Immigrants from South Africa vs Creek In Labor Force | Age 45-54
COMPARE
Immigrants from South Africa
Creek
In Labor Force | Age 45-54
In Labor Force | Age 45-54 Comparison
Immigrants from South Africa
Creek
82.8%
IN LABOR FORCE | AGE 45-54
55.8/ 100
METRIC RATING
168th/ 347
METRIC RANK
77.7%
IN LABOR FORCE | AGE 45-54
0.0/ 100
METRIC RATING
329th/ 347
METRIC RANK
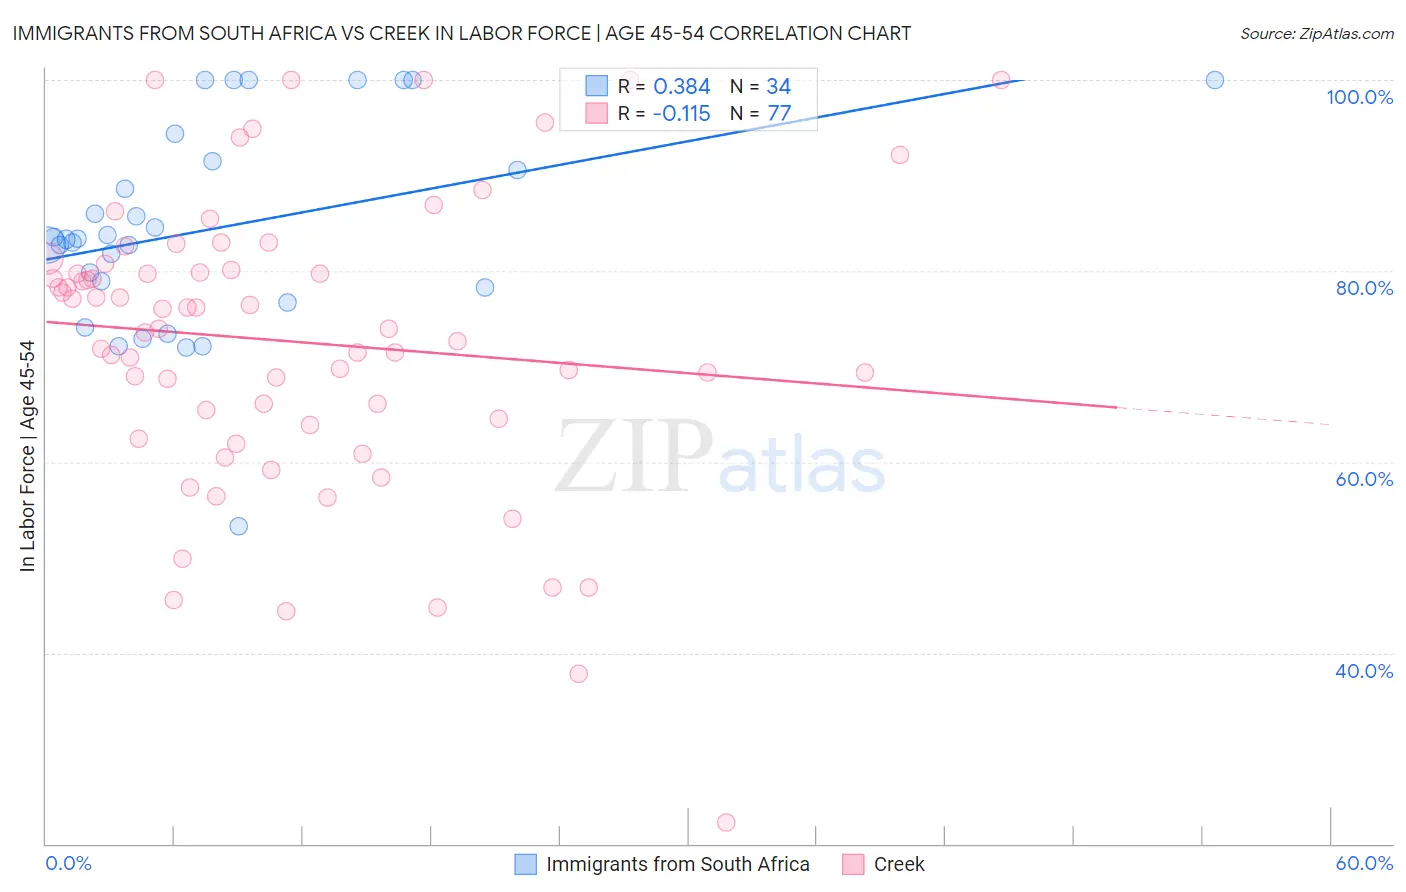
Immigrants from South Africa vs Creek In Labor Force | Age 45-54 Correlation Chart
The statistical analysis conducted on geographies consisting of 233,265,537 people shows a mild positive correlation between the proportion of Immigrants from South Africa and labor force participation rate among population between the ages 45 and 54 in the United States with a correlation coefficient (R) of 0.384 and weighted average of 82.8%. Similarly, the statistical analysis conducted on geographies consisting of 178,432,423 people shows a poor negative correlation between the proportion of Creek and labor force participation rate among population between the ages 45 and 54 in the United States with a correlation coefficient (R) of -0.115 and weighted average of 77.7%, a difference of 6.5%.
In Labor Force | Age 45-54 Correlation Summary
| Measurement | Immigrants from South Africa | Creek |
| Minimum | 53.3% | 22.2% |
| Maximum | 100.0% | 100.0% |
| Range | 46.7% | 77.8% |
| Mean | 84.5% | 72.6% |
| Median | 83.3% | 74.0% |
| Interquartile 25% (IQ1) | 78.2% | 64.2% |
| Interquartile 75% (IQ3) | 91.5% | 80.4% |
| Interquartile Range (IQR) | 13.3% | 16.2% |
| Standard Deviation (Sample) | 10.8% | 15.3% |
| Standard Deviation (Population) | 10.7% | 15.2% |
Similar Demographics by In Labor Force | Age 45-54
Demographics Similar to Immigrants from South Africa by In Labor Force | Age 45-54
In terms of in labor force | age 45-54, the demographic groups most similar to Immigrants from South Africa are Immigrants from South Eastern Asia (82.8%, a difference of 0.010%), Swiss (82.8%, a difference of 0.010%), Immigrants from Western Africa (82.8%, a difference of 0.010%), Pakistani (82.8%, a difference of 0.020%), and Immigrants from Zaire (82.8%, a difference of 0.030%).
| Demographics | Rating | Rank | In Labor Force | Age 45-54 |
| South American Indians | 62.2 /100 | #161 | Good 82.9% |
| Haitians | 61.8 /100 | #162 | Good 82.8% |
| Dutch | 61.7 /100 | #163 | Good 82.8% |
| German Russians | 61.3 /100 | #164 | Good 82.8% |
| Immigrants | Sudan | 59.9 /100 | #165 | Average 82.8% |
| Immigrants | South Eastern Asia | 57.4 /100 | #166 | Average 82.8% |
| Swiss | 56.5 /100 | #167 | Average 82.8% |
| Immigrants | South Africa | 55.8 /100 | #168 | Average 82.8% |
| Immigrants | Western Africa | 54.1 /100 | #169 | Average 82.8% |
| Pakistanis | 53.2 /100 | #170 | Average 82.8% |
| Immigrants | Zaire | 52.9 /100 | #171 | Average 82.8% |
| Icelanders | 51.8 /100 | #172 | Average 82.8% |
| Nicaraguans | 50.3 /100 | #173 | Average 82.8% |
| Costa Ricans | 50.0 /100 | #174 | Average 82.8% |
| Immigrants | Liberia | 47.9 /100 | #175 | Average 82.7% |
Demographics Similar to Creek by In Labor Force | Age 45-54
In terms of in labor force | age 45-54, the demographic groups most similar to Creek are Cheyenne (77.6%, a difference of 0.22%), Sioux (78.0%, a difference of 0.29%), Tsimshian (77.4%, a difference of 0.37%), Menominee (77.4%, a difference of 0.41%), and Cajun (78.1%, a difference of 0.51%).
| Demographics | Rating | Rank | In Labor Force | Age 45-54 |
| Crow | 0.0 /100 | #322 | Tragic 78.3% |
| Kiowa | 0.0 /100 | #323 | Tragic 78.3% |
| Dutch West Indians | 0.0 /100 | #324 | Tragic 78.2% |
| Choctaw | 0.0 /100 | #325 | Tragic 78.2% |
| Seminole | 0.0 /100 | #326 | Tragic 78.1% |
| Cajuns | 0.0 /100 | #327 | Tragic 78.1% |
| Sioux | 0.0 /100 | #328 | Tragic 78.0% |
| Creek | 0.0 /100 | #329 | Tragic 77.7% |
| Cheyenne | 0.0 /100 | #330 | Tragic 77.6% |
| Tsimshian | 0.0 /100 | #331 | Tragic 77.4% |
| Menominee | 0.0 /100 | #332 | Tragic 77.4% |
| Natives/Alaskans | 0.0 /100 | #333 | Tragic 77.1% |
| Apache | 0.0 /100 | #334 | Tragic 77.1% |
| Arapaho | 0.0 /100 | #335 | Tragic 77.1% |
| Paiute | 0.0 /100 | #336 | Tragic 76.7% |