Immigrants from South Africa vs Albanian Family Households
COMPARE
Immigrants from South Africa
Albanian
Family Households
Family Households Comparison
Immigrants from South Africa
Albanians
63.7%
FAMILY HOUSEHOLDS
5.9/ 100
METRIC RATING
221st/ 347
METRIC RANK
63.5%
FAMILY HOUSEHOLDS
2.2/ 100
METRIC RATING
235th/ 347
METRIC RANK
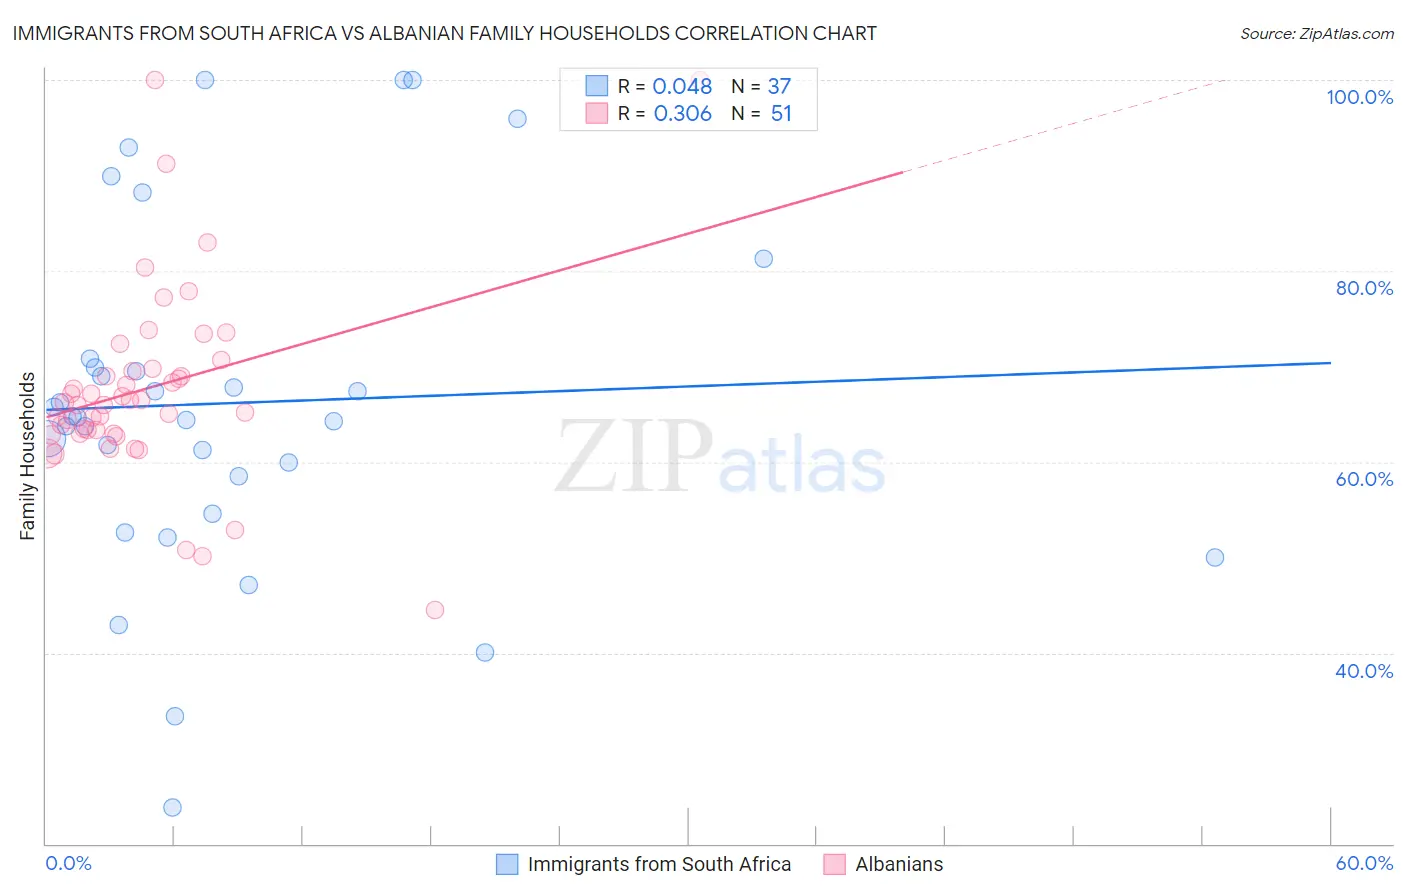
Immigrants from South Africa vs Albanian Family Households Correlation Chart
The statistical analysis conducted on geographies consisting of 233,270,946 people shows no correlation between the proportion of Immigrants from South Africa and percentage of family households in the United States with a correlation coefficient (R) of 0.048 and weighted average of 63.7%. Similarly, the statistical analysis conducted on geographies consisting of 193,187,165 people shows a mild positive correlation between the proportion of Albanians and percentage of family households in the United States with a correlation coefficient (R) of 0.306 and weighted average of 63.5%, a difference of 0.35%.
Family Households Correlation Summary
| Measurement | Immigrants from South Africa | Albanian |
| Minimum | 23.8% | 44.5% |
| Maximum | 100.0% | 100.0% |
| Range | 76.2% | 55.5% |
| Mean | 66.2% | 67.7% |
| Median | 64.6% | 66.2% |
| Interquartile 25% (IQ1) | 56.5% | 62.9% |
| Interquartile 75% (IQ3) | 70.3% | 69.7% |
| Interquartile Range (IQR) | 13.8% | 6.8% |
| Standard Deviation (Sample) | 18.1% | 10.2% |
| Standard Deviation (Population) | 17.9% | 10.1% |
Demographics Similar to Immigrants from South Africa and Albanians by Family Households
In terms of family households, the demographic groups most similar to Immigrants from South Africa are Immigrants from Europe (63.7%, a difference of 0.020%), Macedonian (63.7%, a difference of 0.030%), Immigrants from Belarus (63.7%, a difference of 0.030%), French Canadian (63.7%, a difference of 0.040%), and Marshallese (63.7%, a difference of 0.060%). Similarly, the demographic groups most similar to Albanians are Ghanaian (63.5%, a difference of 0.010%), Comanche (63.5%, a difference of 0.020%), Immigrants from Zimbabwe (63.5%, a difference of 0.020%), Finnish (63.5%, a difference of 0.030%), and Immigrants from Armenia (63.5%, a difference of 0.050%).
| Demographics | Rating | Rank | Family Households |
| Marshallese | 6.9 /100 | #218 | Tragic 63.7% |
| Macedonians | 6.5 /100 | #219 | Tragic 63.7% |
| Immigrants | Europe | 6.4 /100 | #220 | Tragic 63.7% |
| Immigrants | South Africa | 5.9 /100 | #221 | Tragic 63.7% |
| Immigrants | Belarus | 5.5 /100 | #222 | Tragic 63.7% |
| French Canadians | 5.4 /100 | #223 | Tragic 63.7% |
| Turks | 4.5 /100 | #224 | Tragic 63.6% |
| Immigrants | Hungary | 4.3 /100 | #225 | Tragic 63.6% |
| Immigrants | Bahamas | 4.2 /100 | #226 | Tragic 63.6% |
| Trinidadians and Tobagonians | 4.1 /100 | #227 | Tragic 63.6% |
| Blackfeet | 3.6 /100 | #228 | Tragic 63.6% |
| Bulgarians | 3.4 /100 | #229 | Tragic 63.6% |
| Immigrants | Brazil | 3.0 /100 | #230 | Tragic 63.6% |
| Immigrants | Greece | 2.9 /100 | #231 | Tragic 63.5% |
| Immigrants | Northern Africa | 2.6 /100 | #232 | Tragic 63.5% |
| Immigrants | Armenia | 2.6 /100 | #233 | Tragic 63.5% |
| Finns | 2.3 /100 | #234 | Tragic 63.5% |
| Albanians | 2.2 /100 | #235 | Tragic 63.5% |
| Ghanaians | 2.1 /100 | #236 | Tragic 63.5% |
| Comanche | 2.1 /100 | #237 | Tragic 63.5% |
| Immigrants | Zimbabwe | 2.0 /100 | #238 | Tragic 63.5% |