Immigrants from Somalia vs Paraguayan In Labor Force | Age 20-24
COMPARE
Immigrants from Somalia
Paraguayan
In Labor Force | Age 20-24
In Labor Force | Age 20-24 Comparison
Immigrants from Somalia
Paraguayans
79.5%
IN LABOR FORCE | AGE 20-24
100.0/ 100
METRIC RATING
2nd/ 347
METRIC RANK
73.7%
IN LABOR FORCE | AGE 20-24
0.8/ 100
METRIC RATING
257th/ 347
METRIC RANK
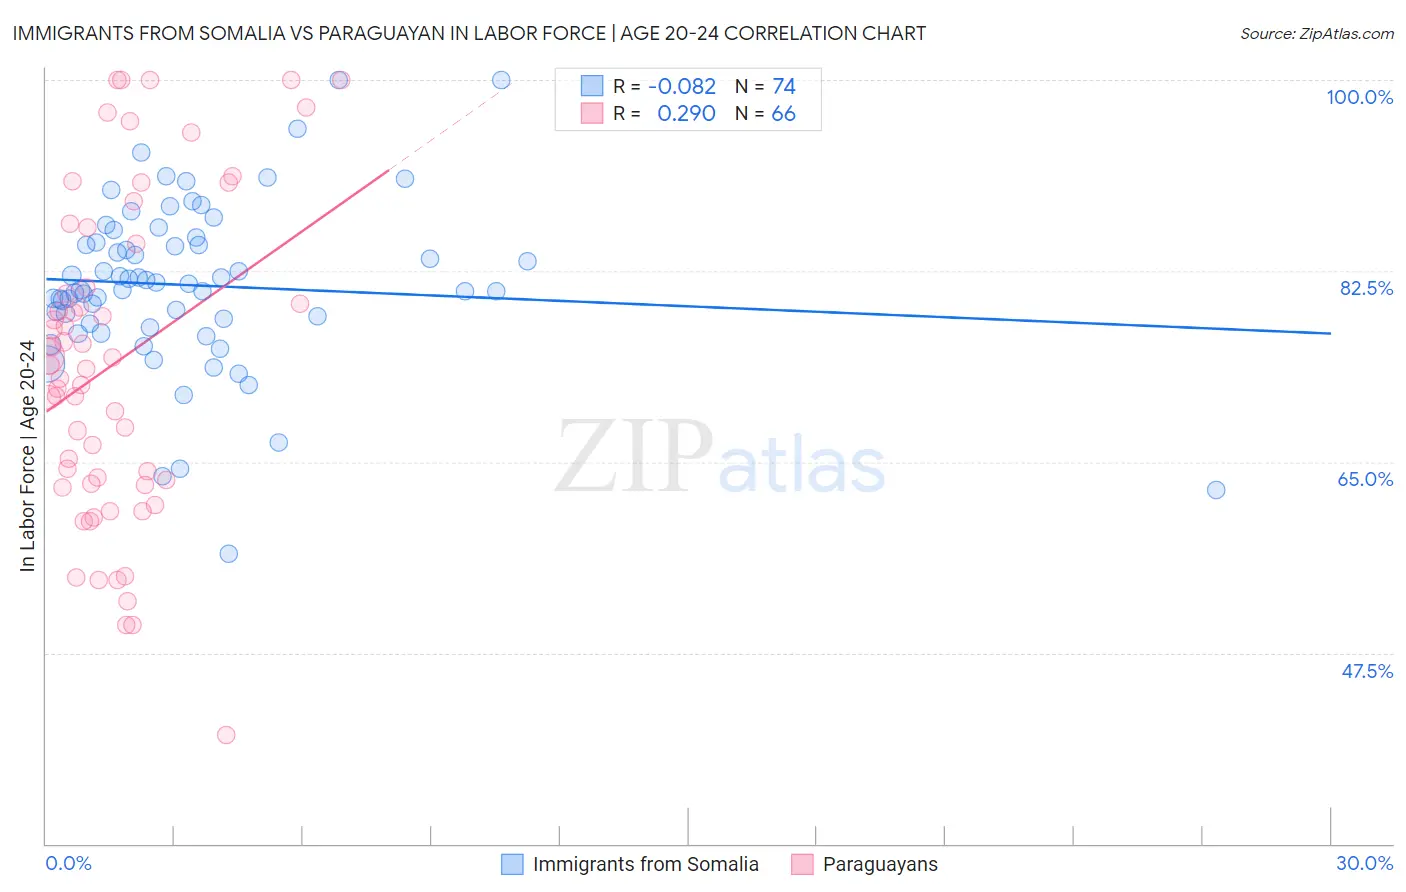
Immigrants from Somalia vs Paraguayan In Labor Force | Age 20-24 Correlation Chart
The statistical analysis conducted on geographies consisting of 92,105,737 people shows a slight negative correlation between the proportion of Immigrants from Somalia and labor force participation rate among population between the ages 20 and 24 in the United States with a correlation coefficient (R) of -0.082 and weighted average of 79.5%. Similarly, the statistical analysis conducted on geographies consisting of 95,113,378 people shows a weak positive correlation between the proportion of Paraguayans and labor force participation rate among population between the ages 20 and 24 in the United States with a correlation coefficient (R) of 0.290 and weighted average of 73.7%, a difference of 7.9%.
In Labor Force | Age 20-24 Correlation Summary
| Measurement | Immigrants from Somalia | Paraguayan |
| Minimum | 56.6% | 40.0% |
| Maximum | 100.0% | 100.0% |
| Range | 43.4% | 60.0% |
| Mean | 81.2% | 74.1% |
| Median | 81.1% | 73.7% |
| Interquartile 25% (IQ1) | 77.7% | 63.0% |
| Interquartile 75% (IQ3) | 85.2% | 85.0% |
| Interquartile Range (IQR) | 7.5% | 22.0% |
| Standard Deviation (Sample) | 7.7% | 14.7% |
| Standard Deviation (Population) | 7.7% | 14.6% |
Similar Demographics by In Labor Force | Age 20-24
Demographics Similar to Immigrants from Somalia by In Labor Force | Age 20-24
In terms of in labor force | age 20-24, the demographic groups most similar to Immigrants from Somalia are Somali (79.3%, a difference of 0.36%), Alaskan Athabascan (79.1%, a difference of 0.55%), Aleut (79.0%, a difference of 0.69%), Danish (79.0%, a difference of 0.70%), and Luxembourger (79.0%, a difference of 0.74%).
| Demographics | Rating | Rank | In Labor Force | Age 20-24 |
| Norwegians | 100.0 /100 | #1 | Exceptional 80.1% |
| Immigrants | Somalia | 100.0 /100 | #2 | Exceptional 79.5% |
| Somalis | 100.0 /100 | #3 | Exceptional 79.3% |
| Alaskan Athabascans | 100.0 /100 | #4 | Exceptional 79.1% |
| Aleuts | 100.0 /100 | #5 | Exceptional 79.0% |
| Danes | 100.0 /100 | #6 | Exceptional 79.0% |
| Luxembourgers | 100.0 /100 | #7 | Exceptional 79.0% |
| Immigrants | Cabo Verde | 100.0 /100 | #8 | Exceptional 78.9% |
| Swedes | 100.0 /100 | #9 | Exceptional 78.8% |
| Slovenes | 100.0 /100 | #10 | Exceptional 78.7% |
| Finns | 100.0 /100 | #11 | Exceptional 78.7% |
| Germans | 100.0 /100 | #12 | Exceptional 78.6% |
| Scandinavians | 100.0 /100 | #13 | Exceptional 78.5% |
| Czechs | 100.0 /100 | #14 | Exceptional 78.5% |
| Sudanese | 100.0 /100 | #15 | Exceptional 78.4% |
Demographics Similar to Paraguayans by In Labor Force | Age 20-24
In terms of in labor force | age 20-24, the demographic groups most similar to Paraguayans are Spanish American Indian (73.7%, a difference of 0.020%), Egyptian (73.7%, a difference of 0.040%), Dutch West Indian (73.7%, a difference of 0.040%), Immigrants from Pakistan (73.8%, a difference of 0.060%), and Immigrants from Turkey (73.7%, a difference of 0.070%).
| Demographics | Rating | Rank | In Labor Force | Age 20-24 |
| Immigrants | Belgium | 1.3 /100 | #250 | Tragic 73.9% |
| Immigrants | Egypt | 1.2 /100 | #251 | Tragic 73.8% |
| Immigrants | Kazakhstan | 1.1 /100 | #252 | Tragic 73.8% |
| Arapaho | 1.0 /100 | #253 | Tragic 73.8% |
| Ute | 1.0 /100 | #254 | Tragic 73.8% |
| Immigrants | Pakistan | 0.9 /100 | #255 | Tragic 73.8% |
| Spanish American Indians | 0.8 /100 | #256 | Tragic 73.7% |
| Paraguayans | 0.8 /100 | #257 | Tragic 73.7% |
| Egyptians | 0.7 /100 | #258 | Tragic 73.7% |
| Dutch West Indians | 0.7 /100 | #259 | Tragic 73.7% |
| Immigrants | Turkey | 0.7 /100 | #260 | Tragic 73.7% |
| Houma | 0.6 /100 | #261 | Tragic 73.7% |
| Asians | 0.6 /100 | #262 | Tragic 73.7% |
| Immigrants | Asia | 0.5 /100 | #263 | Tragic 73.6% |
| Immigrants | Haiti | 0.5 /100 | #264 | Tragic 73.6% |