Immigrants from Singapore vs Romanian In Labor Force | Age 45-54
COMPARE
Immigrants from Singapore
Romanian
In Labor Force | Age 45-54
In Labor Force | Age 45-54 Comparison
Immigrants from Singapore
Romanians
83.3%
IN LABOR FORCE | AGE 45-54
93.9/ 100
METRIC RATING
102nd/ 347
METRIC RANK
83.0%
IN LABOR FORCE | AGE 45-54
75.4/ 100
METRIC RATING
145th/ 347
METRIC RANK
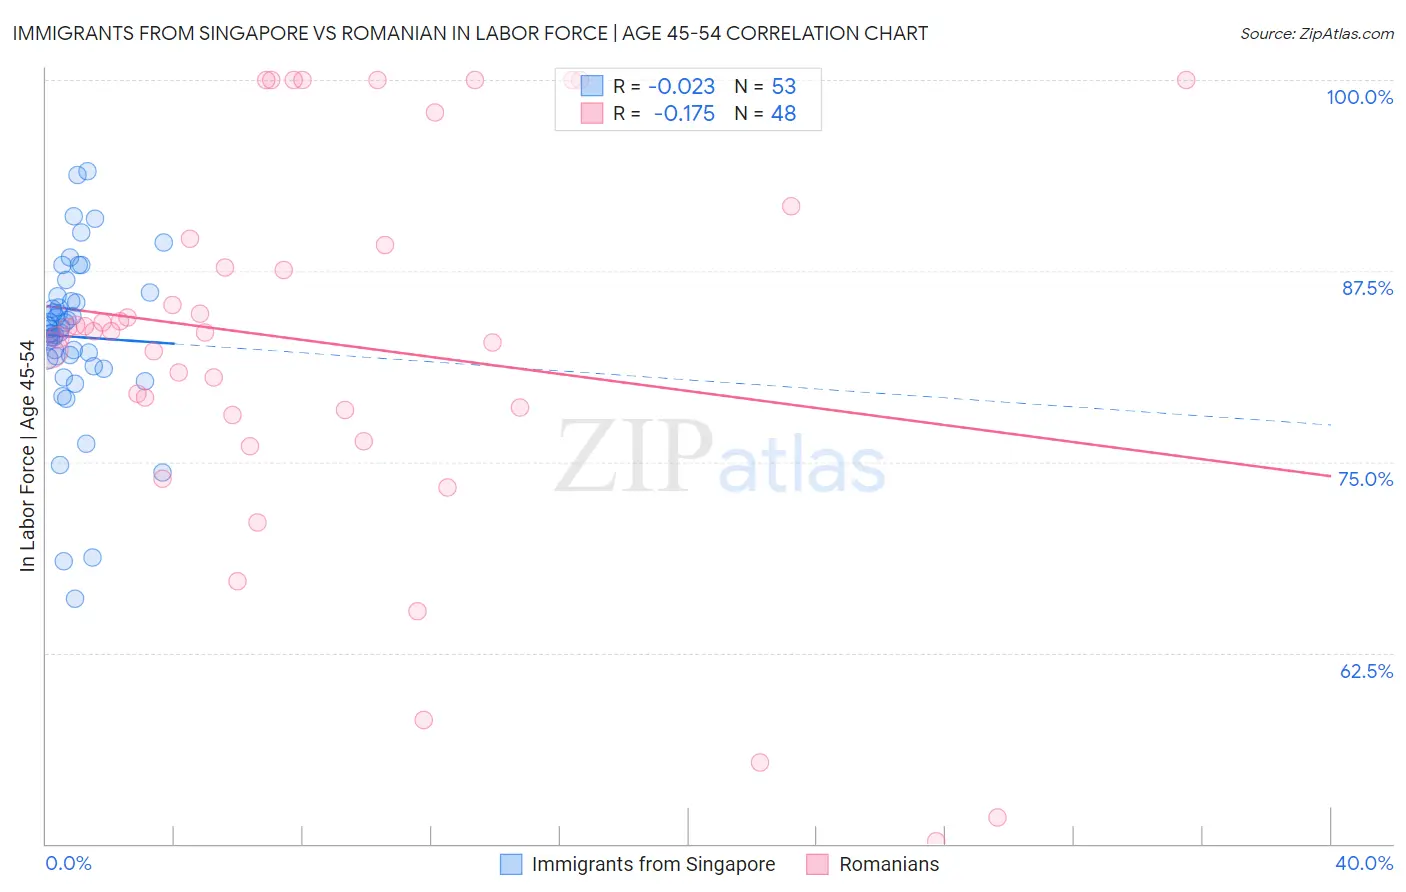
Immigrants from Singapore vs Romanian In Labor Force | Age 45-54 Correlation Chart
The statistical analysis conducted on geographies consisting of 137,447,922 people shows no correlation between the proportion of Immigrants from Singapore and labor force participation rate among population between the ages 45 and 54 in the United States with a correlation coefficient (R) of -0.023 and weighted average of 83.3%. Similarly, the statistical analysis conducted on geographies consisting of 377,704,914 people shows a poor negative correlation between the proportion of Romanians and labor force participation rate among population between the ages 45 and 54 in the United States with a correlation coefficient (R) of -0.175 and weighted average of 83.0%, a difference of 0.35%.
In Labor Force | Age 45-54 Correlation Summary
| Measurement | Immigrants from Singapore | Romanian |
| Minimum | 66.0% | 50.2% |
| Maximum | 94.0% | 100.0% |
| Range | 28.0% | 49.8% |
| Mean | 83.2% | 82.8% |
| Median | 83.7% | 83.5% |
| Interquartile 25% (IQ1) | 81.5% | 78.2% |
| Interquartile 75% (IQ3) | 85.7% | 89.4% |
| Interquartile Range (IQR) | 4.2% | 11.2% |
| Standard Deviation (Sample) | 5.5% | 12.7% |
| Standard Deviation (Population) | 5.5% | 12.6% |
Similar Demographics by In Labor Force | Age 45-54
Demographics Similar to Immigrants from Singapore by In Labor Force | Age 45-54
In terms of in labor force | age 45-54, the demographic groups most similar to Immigrants from Singapore are Albanian (83.3%, a difference of 0.0%), Immigrants from Romania (83.3%, a difference of 0.0%), Immigrants from Middle Africa (83.3%, a difference of 0.010%), Mongolian (83.3%, a difference of 0.010%), and Immigrants from Belarus (83.3%, a difference of 0.010%).
| Demographics | Rating | Rank | In Labor Force | Age 45-54 |
| Immigrants | Argentina | 94.9 /100 | #95 | Exceptional 83.3% |
| Immigrants | Kuwait | 94.8 /100 | #96 | Exceptional 83.3% |
| Palestinians | 94.8 /100 | #97 | Exceptional 83.3% |
| Maltese | 94.4 /100 | #98 | Exceptional 83.3% |
| Immigrants | Middle Africa | 94.3 /100 | #99 | Exceptional 83.3% |
| Mongolians | 94.2 /100 | #100 | Exceptional 83.3% |
| Immigrants | Belarus | 94.1 /100 | #101 | Exceptional 83.3% |
| Immigrants | Singapore | 93.9 /100 | #102 | Exceptional 83.3% |
| Albanians | 93.9 /100 | #103 | Exceptional 83.3% |
| Immigrants | Romania | 93.8 /100 | #104 | Exceptional 83.3% |
| Immigrants | South America | 93.5 /100 | #105 | Exceptional 83.2% |
| Sri Lankans | 93.2 /100 | #106 | Exceptional 83.2% |
| Iranians | 92.9 /100 | #107 | Exceptional 83.2% |
| Slovaks | 92.8 /100 | #108 | Exceptional 83.2% |
| Ukrainians | 92.7 /100 | #109 | Exceptional 83.2% |
Demographics Similar to Romanians by In Labor Force | Age 45-54
In terms of in labor force | age 45-54, the demographic groups most similar to Romanians are Immigrants from France (83.0%, a difference of 0.0%), Czechoslovakian (83.0%, a difference of 0.010%), Okinawan (83.0%, a difference of 0.020%), Soviet Union (83.0%, a difference of 0.020%), and Immigrants from Nigeria (83.0%, a difference of 0.020%).
| Demographics | Rating | Rank | In Labor Force | Age 45-54 |
| Ghanaians | 79.5 /100 | #138 | Good 83.0% |
| Scandinavians | 78.5 /100 | #139 | Good 83.0% |
| Yugoslavians | 78.3 /100 | #140 | Good 83.0% |
| Immigrants | Haiti | 77.9 /100 | #141 | Good 83.0% |
| Immigrants | Scotland | 77.8 /100 | #142 | Good 83.0% |
| Okinawans | 77.0 /100 | #143 | Good 83.0% |
| Soviet Union | 76.8 /100 | #144 | Good 83.0% |
| Romanians | 75.4 /100 | #145 | Good 83.0% |
| Immigrants | France | 75.3 /100 | #146 | Good 83.0% |
| Czechoslovakians | 74.8 /100 | #147 | Good 83.0% |
| Immigrants | Nigeria | 74.1 /100 | #148 | Good 83.0% |
| Immigrants | Sweden | 73.3 /100 | #149 | Good 82.9% |
| Immigrants | Netherlands | 72.6 /100 | #150 | Good 82.9% |
| Koreans | 71.9 /100 | #151 | Good 82.9% |
| Slavs | 71.5 /100 | #152 | Good 82.9% |