Immigrants from Serbia vs Ecuadorian In Labor Force | Age > 16
COMPARE
Immigrants from Serbia
Ecuadorian
In Labor Force | Age > 16
In Labor Force | Age > 16 Comparison
Immigrants from Serbia
Ecuadorians
65.8%
IN LABOR FORCE | AGE > 16
98.1/ 100
METRIC RATING
106th/ 347
METRIC RANK
65.6%
IN LABOR FORCE | AGE > 16
94.7/ 100
METRIC RATING
128th/ 347
METRIC RANK
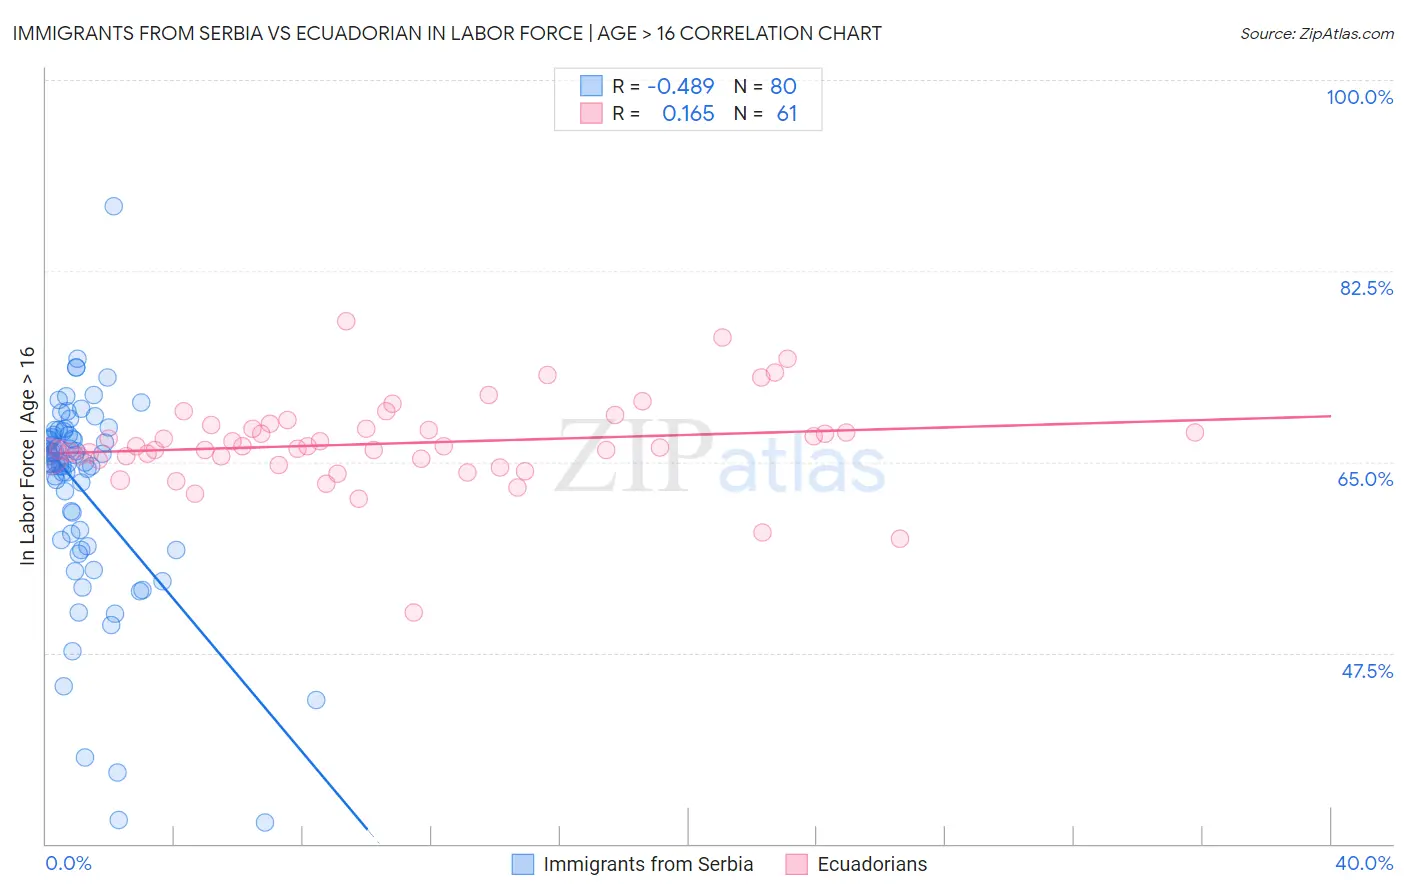
Immigrants from Serbia vs Ecuadorian In Labor Force | Age > 16 Correlation Chart
The statistical analysis conducted on geographies consisting of 131,746,975 people shows a moderate negative correlation between the proportion of Immigrants from Serbia and labor force participation rate among population ages 16 and over in the United States with a correlation coefficient (R) of -0.489 and weighted average of 65.8%. Similarly, the statistical analysis conducted on geographies consisting of 317,862,233 people shows a poor positive correlation between the proportion of Ecuadorians and labor force participation rate among population ages 16 and over in the United States with a correlation coefficient (R) of 0.165 and weighted average of 65.6%, a difference of 0.30%.
In Labor Force | Age > 16 Correlation Summary
| Measurement | Immigrants from Serbia | Ecuadorian |
| Minimum | 31.9% | 51.2% |
| Maximum | 88.4% | 77.9% |
| Range | 56.5% | 26.7% |
| Mean | 62.3% | 66.7% |
| Median | 64.9% | 66.4% |
| Interquartile 25% (IQ1) | 57.5% | 65.3% |
| Interquartile 75% (IQ3) | 67.5% | 68.2% |
| Interquartile Range (IQR) | 9.9% | 3.0% |
| Standard Deviation (Sample) | 9.6% | 4.1% |
| Standard Deviation (Population) | 9.5% | 4.1% |
Similar Demographics by In Labor Force | Age > 16
Demographics Similar to Immigrants from Serbia by In Labor Force | Age > 16
In terms of in labor force | age > 16, the demographic groups most similar to Immigrants from Serbia are Immigrants from Poland (65.8%, a difference of 0.0%), Immigrants from Spain (65.8%, a difference of 0.020%), Immigrants from Japan (65.8%, a difference of 0.020%), Colombian (65.9%, a difference of 0.040%), and Palestinian (65.9%, a difference of 0.050%).
| Demographics | Rating | Rank | In Labor Force | Age > 16 |
| Immigrants | Australia | 98.7 /100 | #99 | Exceptional 65.9% |
| Okinawans | 98.7 /100 | #100 | Exceptional 65.9% |
| Immigrants | Colombia | 98.6 /100 | #101 | Exceptional 65.9% |
| Uruguayans | 98.6 /100 | #102 | Exceptional 65.9% |
| Immigrants | South Eastern Asia | 98.5 /100 | #103 | Exceptional 65.9% |
| Palestinians | 98.5 /100 | #104 | Exceptional 65.9% |
| Colombians | 98.4 /100 | #105 | Exceptional 65.9% |
| Immigrants | Serbia | 98.1 /100 | #106 | Exceptional 65.8% |
| Immigrants | Poland | 98.1 /100 | #107 | Exceptional 65.8% |
| Immigrants | Spain | 98.0 /100 | #108 | Exceptional 65.8% |
| Immigrants | Japan | 98.0 /100 | #109 | Exceptional 65.8% |
| Japanese | 97.7 /100 | #110 | Exceptional 65.8% |
| Immigrants | Honduras | 97.5 /100 | #111 | Exceptional 65.8% |
| Laotians | 97.4 /100 | #112 | Exceptional 65.8% |
| Pakistanis | 97.1 /100 | #113 | Exceptional 65.8% |
Demographics Similar to Ecuadorians by In Labor Force | Age > 16
In terms of in labor force | age > 16, the demographic groups most similar to Ecuadorians are Immigrants from Eastern Asia (65.7%, a difference of 0.010%), Immigrants from Philippines (65.6%, a difference of 0.010%), Immigrants from Guatemala (65.6%, a difference of 0.020%), Icelander (65.6%, a difference of 0.020%), and Norwegian (65.7%, a difference of 0.030%).
| Demographics | Rating | Rank | In Labor Force | Age > 16 |
| New Zealanders | 96.0 /100 | #121 | Exceptional 65.7% |
| Immigrants | Ecuador | 95.9 /100 | #122 | Exceptional 65.7% |
| Immigrants | Iraq | 95.5 /100 | #123 | Exceptional 65.7% |
| Iraqis | 95.4 /100 | #124 | Exceptional 65.7% |
| Norwegians | 95.3 /100 | #125 | Exceptional 65.7% |
| Koreans | 95.3 /100 | #126 | Exceptional 65.7% |
| Immigrants | Eastern Asia | 94.9 /100 | #127 | Exceptional 65.7% |
| Ecuadorians | 94.7 /100 | #128 | Exceptional 65.6% |
| Immigrants | Philippines | 94.5 /100 | #129 | Exceptional 65.6% |
| Immigrants | Guatemala | 94.4 /100 | #130 | Exceptional 65.6% |
| Icelanders | 94.3 /100 | #131 | Exceptional 65.6% |
| Immigrants | North Macedonia | 94.1 /100 | #132 | Exceptional 65.6% |
| Immigrants | Lithuania | 93.5 /100 | #133 | Exceptional 65.6% |
| Costa Ricans | 93.2 /100 | #134 | Exceptional 65.6% |
| Guatemalans | 92.5 /100 | #135 | Exceptional 65.6% |