Immigrants from Senegal vs Turkish In Labor Force | Age 45-54
COMPARE
Immigrants from Senegal
Turkish
In Labor Force | Age 45-54
In Labor Force | Age 45-54 Comparison
Immigrants from Senegal
Turks
82.0%
IN LABOR FORCE | AGE 45-54
1.7/ 100
METRIC RATING
231st/ 347
METRIC RANK
83.8%
IN LABOR FORCE | AGE 45-54
99.7/ 100
METRIC RATING
32nd/ 347
METRIC RANK
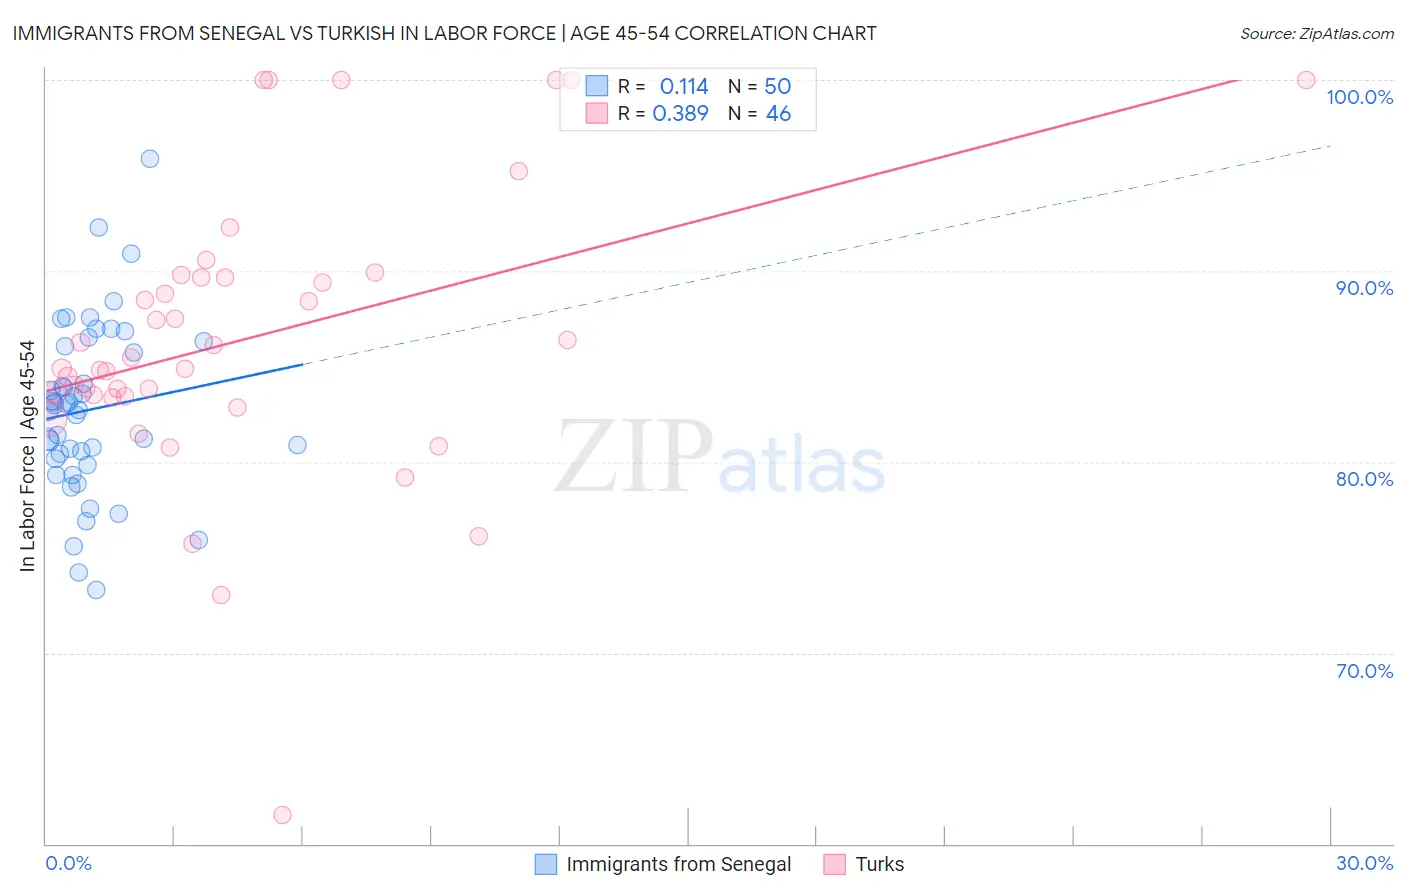
Immigrants from Senegal vs Turkish In Labor Force | Age 45-54 Correlation Chart
The statistical analysis conducted on geographies consisting of 90,120,202 people shows a poor positive correlation between the proportion of Immigrants from Senegal and labor force participation rate among population between the ages 45 and 54 in the United States with a correlation coefficient (R) of 0.114 and weighted average of 82.0%. Similarly, the statistical analysis conducted on geographies consisting of 271,698,387 people shows a mild positive correlation between the proportion of Turks and labor force participation rate among population between the ages 45 and 54 in the United States with a correlation coefficient (R) of 0.389 and weighted average of 83.8%, a difference of 2.2%.
In Labor Force | Age 45-54 Correlation Summary
| Measurement | Immigrants from Senegal | Turkish |
| Minimum | 73.3% | 61.5% |
| Maximum | 95.9% | 100.0% |
| Range | 22.6% | 38.5% |
| Mean | 82.7% | 86.5% |
| Median | 82.9% | 85.2% |
| Interquartile 25% (IQ1) | 80.2% | 83.4% |
| Interquartile 75% (IQ3) | 86.1% | 89.6% |
| Interquartile Range (IQR) | 5.9% | 6.2% |
| Standard Deviation (Sample) | 4.5% | 7.6% |
| Standard Deviation (Population) | 4.5% | 7.5% |
Similar Demographics by In Labor Force | Age 45-54
Demographics Similar to Immigrants from Senegal by In Labor Force | Age 45-54
In terms of in labor force | age 45-54, the demographic groups most similar to Immigrants from Senegal are Immigrants from Portugal (82.0%, a difference of 0.0%), Jamaican (82.0%, a difference of 0.010%), Malaysian (82.0%, a difference of 0.010%), Salvadoran (82.0%, a difference of 0.010%), and Immigrants from Burma/Myanmar (82.0%, a difference of 0.030%).
| Demographics | Rating | Rank | In Labor Force | Age 45-54 |
| Immigrants | Jamaica | 2.7 /100 | #224 | Tragic 82.1% |
| Immigrants | Oceania | 2.5 /100 | #225 | Tragic 82.1% |
| Immigrants | Caribbean | 2.5 /100 | #226 | Tragic 82.1% |
| Immigrants | Germany | 2.4 /100 | #227 | Tragic 82.1% |
| Cape Verdeans | 2.1 /100 | #228 | Tragic 82.1% |
| Immigrants | Burma/Myanmar | 1.9 /100 | #229 | Tragic 82.0% |
| Jamaicans | 1.8 /100 | #230 | Tragic 82.0% |
| Immigrants | Senegal | 1.7 /100 | #231 | Tragic 82.0% |
| Immigrants | Portugal | 1.7 /100 | #232 | Tragic 82.0% |
| Malaysians | 1.7 /100 | #233 | Tragic 82.0% |
| Salvadorans | 1.7 /100 | #234 | Tragic 82.0% |
| Sub-Saharan Africans | 1.2 /100 | #235 | Tragic 82.0% |
| Basques | 1.2 /100 | #236 | Tragic 82.0% |
| Immigrants | Trinidad and Tobago | 1.2 /100 | #237 | Tragic 82.0% |
| Trinidadians and Tobagonians | 1.1 /100 | #238 | Tragic 81.9% |
Demographics Similar to Turks by In Labor Force | Age 45-54
In terms of in labor force | age 45-54, the demographic groups most similar to Turks are Latvian (83.8%, a difference of 0.010%), Immigrants from Eritrea (83.8%, a difference of 0.020%), Immigrants from Bulgaria (83.8%, a difference of 0.040%), Immigrants from Pakistan (83.8%, a difference of 0.060%), and Immigrants from Lithuania (83.9%, a difference of 0.080%).
| Demographics | Rating | Rank | In Labor Force | Age 45-54 |
| Immigrants | North Macedonia | 99.8 /100 | #25 | Exceptional 83.9% |
| Immigrants | Serbia | 99.8 /100 | #26 | Exceptional 83.9% |
| Immigrants | Brazil | 99.8 /100 | #27 | Exceptional 83.9% |
| Immigrants | Lithuania | 99.8 /100 | #28 | Exceptional 83.9% |
| Immigrants | Pakistan | 99.7 /100 | #29 | Exceptional 83.8% |
| Immigrants | Bulgaria | 99.7 /100 | #30 | Exceptional 83.8% |
| Immigrants | Eritrea | 99.7 /100 | #31 | Exceptional 83.8% |
| Turks | 99.7 /100 | #32 | Exceptional 83.8% |
| Latvians | 99.7 /100 | #33 | Exceptional 83.8% |
| Kenyans | 99.5 /100 | #34 | Exceptional 83.7% |
| Brazilians | 99.5 /100 | #35 | Exceptional 83.7% |
| Ugandans | 99.5 /100 | #36 | Exceptional 83.7% |
| Swedes | 99.4 /100 | #37 | Exceptional 83.7% |
| Immigrants | Venezuela | 99.4 /100 | #38 | Exceptional 83.7% |
| Immigrants | Cuba | 99.4 /100 | #39 | Exceptional 83.7% |