Barbadian vs Uruguayan In Labor Force | Age 45-54
COMPARE
Barbadian
Uruguayan
In Labor Force | Age 45-54
In Labor Force | Age 45-54 Comparison
Barbadians
Uruguayans
81.6%
IN LABOR FORCE | AGE 45-54
0.1/ 100
METRIC RATING
256th/ 347
METRIC RANK
83.1%
IN LABOR FORCE | AGE 45-54
89.4/ 100
METRIC RATING
121st/ 347
METRIC RANK
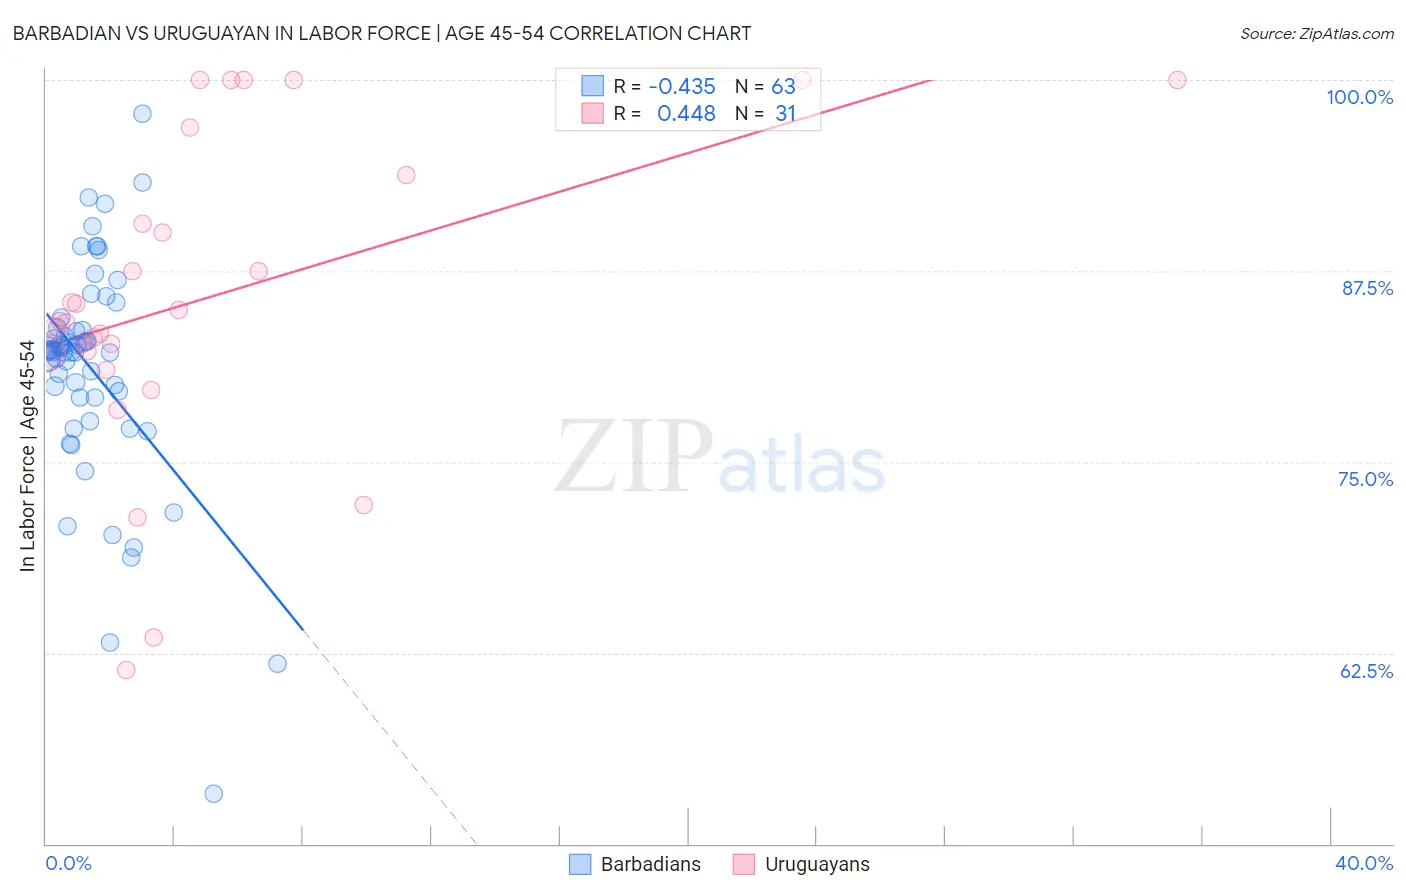
Barbadian vs Uruguayan In Labor Force | Age 45-54 Correlation Chart
The statistical analysis conducted on geographies consisting of 141,264,705 people shows a moderate negative correlation between the proportion of Barbadians and labor force participation rate among population between the ages 45 and 54 in the United States with a correlation coefficient (R) of -0.435 and weighted average of 81.6%. Similarly, the statistical analysis conducted on geographies consisting of 144,763,514 people shows a moderate positive correlation between the proportion of Uruguayans and labor force participation rate among population between the ages 45 and 54 in the United States with a correlation coefficient (R) of 0.448 and weighted average of 83.1%, a difference of 1.9%.
In Labor Force | Age 45-54 Correlation Summary
| Measurement | Barbadian | Uruguayan |
| Minimum | 53.3% | 61.4% |
| Maximum | 97.8% | 100.0% |
| Range | 44.5% | 38.6% |
| Mean | 81.1% | 85.7% |
| Median | 82.3% | 84.2% |
| Interquartile 25% (IQ1) | 79.2% | 82.1% |
| Interquartile 75% (IQ3) | 83.8% | 93.8% |
| Interquartile Range (IQR) | 4.6% | 11.7% |
| Standard Deviation (Sample) | 7.5% | 10.2% |
| Standard Deviation (Population) | 7.4% | 10.0% |
Similar Demographics by In Labor Force | Age 45-54
Demographics Similar to Barbadians by In Labor Force | Age 45-54
In terms of in labor force | age 45-54, the demographic groups most similar to Barbadians are Immigrants from Congo (81.6%, a difference of 0.020%), Scotch-Irish (81.6%, a difference of 0.030%), Immigrants from Fiji (81.5%, a difference of 0.030%), Immigrants from Laos (81.6%, a difference of 0.040%), and Guyanese (81.5%, a difference of 0.040%).
| Demographics | Rating | Rank | In Labor Force | Age 45-54 |
| Hmong | 0.3 /100 | #249 | Tragic 81.7% |
| Immigrants | Armenia | 0.2 /100 | #250 | Tragic 81.7% |
| Guamanians/Chamorros | 0.2 /100 | #251 | Tragic 81.6% |
| Pennsylvania Germans | 0.2 /100 | #252 | Tragic 81.6% |
| Japanese | 0.2 /100 | #253 | Tragic 81.6% |
| Immigrants | Laos | 0.2 /100 | #254 | Tragic 81.6% |
| Scotch-Irish | 0.2 /100 | #255 | Tragic 81.6% |
| Barbadians | 0.1 /100 | #256 | Tragic 81.6% |
| Immigrants | Congo | 0.1 /100 | #257 | Tragic 81.6% |
| Immigrants | Fiji | 0.1 /100 | #258 | Tragic 81.5% |
| Guyanese | 0.1 /100 | #259 | Tragic 81.5% |
| Spaniards | 0.1 /100 | #260 | Tragic 81.5% |
| Hawaiians | 0.1 /100 | #261 | Tragic 81.5% |
| Immigrants | Guyana | 0.1 /100 | #262 | Tragic 81.5% |
| Indonesians | 0.1 /100 | #263 | Tragic 81.5% |
Demographics Similar to Uruguayans by In Labor Force | Age 45-54
In terms of in labor force | age 45-54, the demographic groups most similar to Uruguayans are Immigrants from Vietnam (83.1%, a difference of 0.010%), Immigrants from Uruguay (83.2%, a difference of 0.020%), Immigrants from Russia (83.2%, a difference of 0.020%), Tongan (83.1%, a difference of 0.020%), and Immigrants from Europe (83.2%, a difference of 0.030%).
| Demographics | Rating | Rank | In Labor Force | Age 45-54 |
| Assyrians/Chaldeans/Syriacs | 91.7 /100 | #114 | Exceptional 83.2% |
| Immigrants | Chile | 91.6 /100 | #115 | Exceptional 83.2% |
| Immigrants | Malaysia | 91.4 /100 | #116 | Exceptional 83.2% |
| Immigrants | China | 90.9 /100 | #117 | Exceptional 83.2% |
| Immigrants | Europe | 90.7 /100 | #118 | Exceptional 83.2% |
| Immigrants | Uruguay | 90.2 /100 | #119 | Exceptional 83.2% |
| Immigrants | Russia | 90.1 /100 | #120 | Exceptional 83.2% |
| Uruguayans | 89.4 /100 | #121 | Excellent 83.1% |
| Immigrants | Vietnam | 88.9 /100 | #122 | Excellent 83.1% |
| Tongans | 88.2 /100 | #123 | Excellent 83.1% |
| Bermudans | 88.0 /100 | #124 | Excellent 83.1% |
| Immigrants | Iran | 87.2 /100 | #125 | Excellent 83.1% |
| Immigrants | Belgium | 86.4 /100 | #126 | Excellent 83.1% |
| Immigrants | Jordan | 85.2 /100 | #127 | Excellent 83.1% |
| Germans | 85.1 /100 | #128 | Excellent 83.1% |