Immigrants from Russia vs Maltese In Labor Force | Age 45-54
COMPARE
Immigrants from Russia
Maltese
In Labor Force | Age 45-54
In Labor Force | Age 45-54 Comparison
Immigrants from Russia
Maltese
83.2%
IN LABOR FORCE | AGE 45-54
90.1/ 100
METRIC RATING
120th/ 347
METRIC RANK
83.3%
IN LABOR FORCE | AGE 45-54
94.4/ 100
METRIC RATING
98th/ 347
METRIC RANK
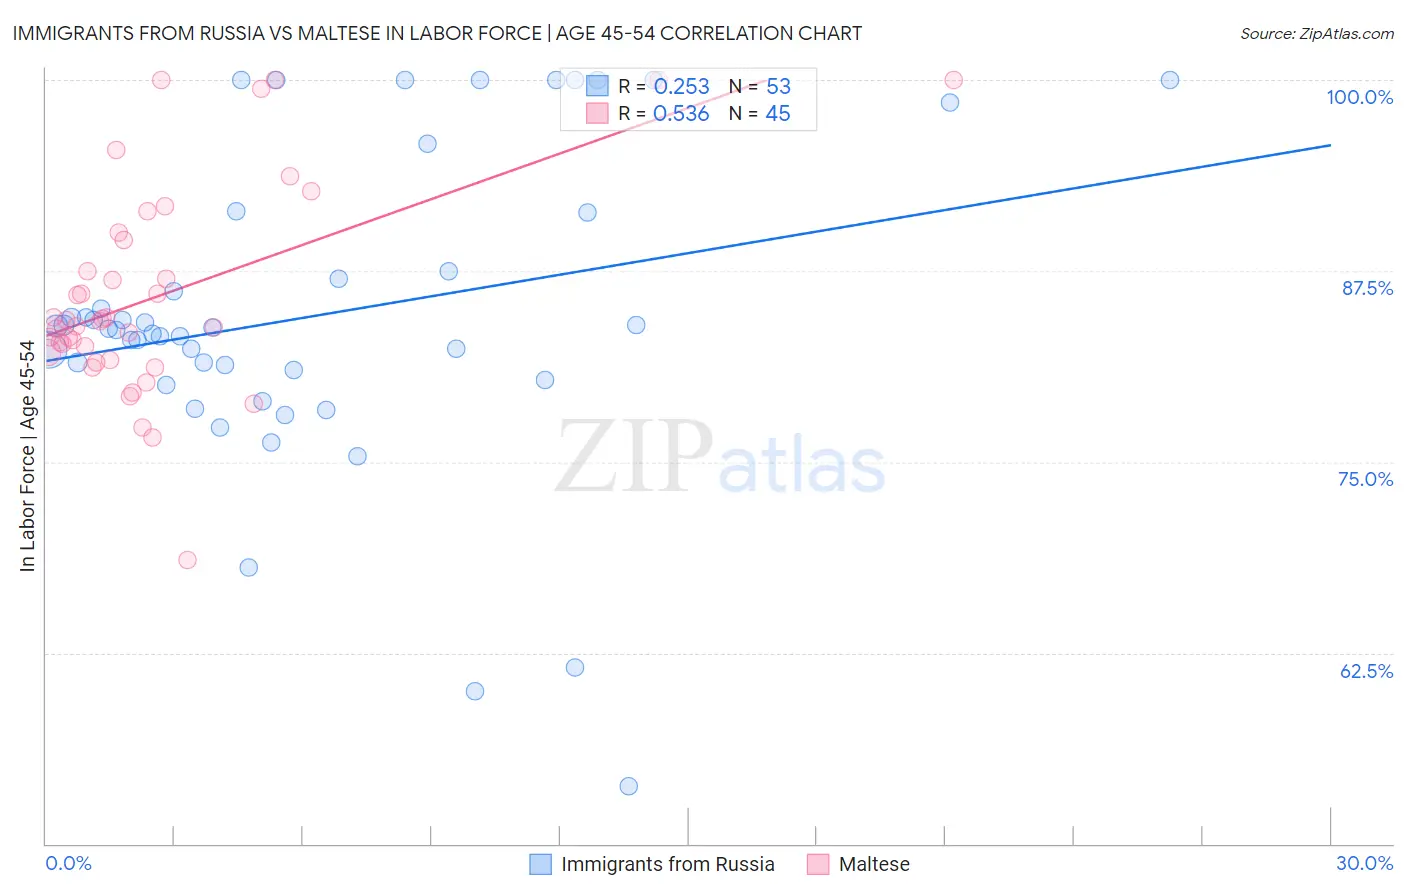
Immigrants from Russia vs Maltese In Labor Force | Age 45-54 Correlation Chart
The statistical analysis conducted on geographies consisting of 347,716,687 people shows a weak positive correlation between the proportion of Immigrants from Russia and labor force participation rate among population between the ages 45 and 54 in the United States with a correlation coefficient (R) of 0.253 and weighted average of 83.2%. Similarly, the statistical analysis conducted on geographies consisting of 126,435,946 people shows a substantial positive correlation between the proportion of Maltese and labor force participation rate among population between the ages 45 and 54 in the United States with a correlation coefficient (R) of 0.536 and weighted average of 83.3%, a difference of 0.14%.
In Labor Force | Age 45-54 Correlation Summary
| Measurement | Immigrants from Russia | Maltese |
| Minimum | 53.8% | 68.6% |
| Maximum | 100.0% | 100.0% |
| Range | 46.2% | 31.4% |
| Mean | 84.6% | 85.9% |
| Median | 83.7% | 84.2% |
| Interquartile 25% (IQ1) | 80.7% | 81.9% |
| Interquartile 75% (IQ3) | 89.4% | 89.8% |
| Interquartile Range (IQR) | 8.7% | 7.9% |
| Standard Deviation (Sample) | 10.2% | 6.9% |
| Standard Deviation (Population) | 10.1% | 6.8% |
Similar Demographics by In Labor Force | Age 45-54
Demographics Similar to Immigrants from Russia by In Labor Force | Age 45-54
In terms of in labor force | age 45-54, the demographic groups most similar to Immigrants from Russia are Immigrants from Uruguay (83.2%, a difference of 0.0%), Immigrants from Europe (83.2%, a difference of 0.010%), Immigrants from China (83.2%, a difference of 0.020%), Uruguayan (83.1%, a difference of 0.020%), and Immigrants from Vietnam (83.1%, a difference of 0.030%).
| Demographics | Rating | Rank | In Labor Force | Age 45-54 |
| Immigrants | Albania | 91.8 /100 | #113 | Exceptional 83.2% |
| Assyrians/Chaldeans/Syriacs | 91.7 /100 | #114 | Exceptional 83.2% |
| Immigrants | Chile | 91.6 /100 | #115 | Exceptional 83.2% |
| Immigrants | Malaysia | 91.4 /100 | #116 | Exceptional 83.2% |
| Immigrants | China | 90.9 /100 | #117 | Exceptional 83.2% |
| Immigrants | Europe | 90.7 /100 | #118 | Exceptional 83.2% |
| Immigrants | Uruguay | 90.2 /100 | #119 | Exceptional 83.2% |
| Immigrants | Russia | 90.1 /100 | #120 | Exceptional 83.2% |
| Uruguayans | 89.4 /100 | #121 | Excellent 83.1% |
| Immigrants | Vietnam | 88.9 /100 | #122 | Excellent 83.1% |
| Tongans | 88.2 /100 | #123 | Excellent 83.1% |
| Bermudans | 88.0 /100 | #124 | Excellent 83.1% |
| Immigrants | Iran | 87.2 /100 | #125 | Excellent 83.1% |
| Immigrants | Belgium | 86.4 /100 | #126 | Excellent 83.1% |
| Immigrants | Jordan | 85.2 /100 | #127 | Excellent 83.1% |
Demographics Similar to Maltese by In Labor Force | Age 45-54
In terms of in labor force | age 45-54, the demographic groups most similar to Maltese are Palestinian (83.3%, a difference of 0.010%), Immigrants from Middle Africa (83.3%, a difference of 0.010%), Mongolian (83.3%, a difference of 0.010%), Immigrants from Belarus (83.3%, a difference of 0.010%), and Argentinean (83.3%, a difference of 0.020%).
| Demographics | Rating | Rank | In Labor Force | Age 45-54 |
| South Americans | 95.5 /100 | #91 | Exceptional 83.3% |
| Danes | 95.3 /100 | #92 | Exceptional 83.3% |
| Italians | 95.1 /100 | #93 | Exceptional 83.3% |
| Argentineans | 94.9 /100 | #94 | Exceptional 83.3% |
| Immigrants | Argentina | 94.9 /100 | #95 | Exceptional 83.3% |
| Immigrants | Kuwait | 94.8 /100 | #96 | Exceptional 83.3% |
| Palestinians | 94.8 /100 | #97 | Exceptional 83.3% |
| Maltese | 94.4 /100 | #98 | Exceptional 83.3% |
| Immigrants | Middle Africa | 94.3 /100 | #99 | Exceptional 83.3% |
| Mongolians | 94.2 /100 | #100 | Exceptional 83.3% |
| Immigrants | Belarus | 94.1 /100 | #101 | Exceptional 83.3% |
| Immigrants | Singapore | 93.9 /100 | #102 | Exceptional 83.3% |
| Albanians | 93.9 /100 | #103 | Exceptional 83.3% |
| Immigrants | Romania | 93.8 /100 | #104 | Exceptional 83.3% |
| Immigrants | South America | 93.5 /100 | #105 | Exceptional 83.2% |