Immigrants from Romania vs Alaska Native In Labor Force | Age 16-19
COMPARE
Immigrants from Romania
Alaska Native
In Labor Force | Age 16-19
In Labor Force | Age 16-19 Comparison
Immigrants from Romania
Alaska Natives
36.3%
IN LABOR FORCE | AGE 16-19
34.0/ 100
METRIC RATING
186th/ 347
METRIC RANK
39.1%
IN LABOR FORCE | AGE 16-19
99.6/ 100
METRIC RATING
89th/ 347
METRIC RANK
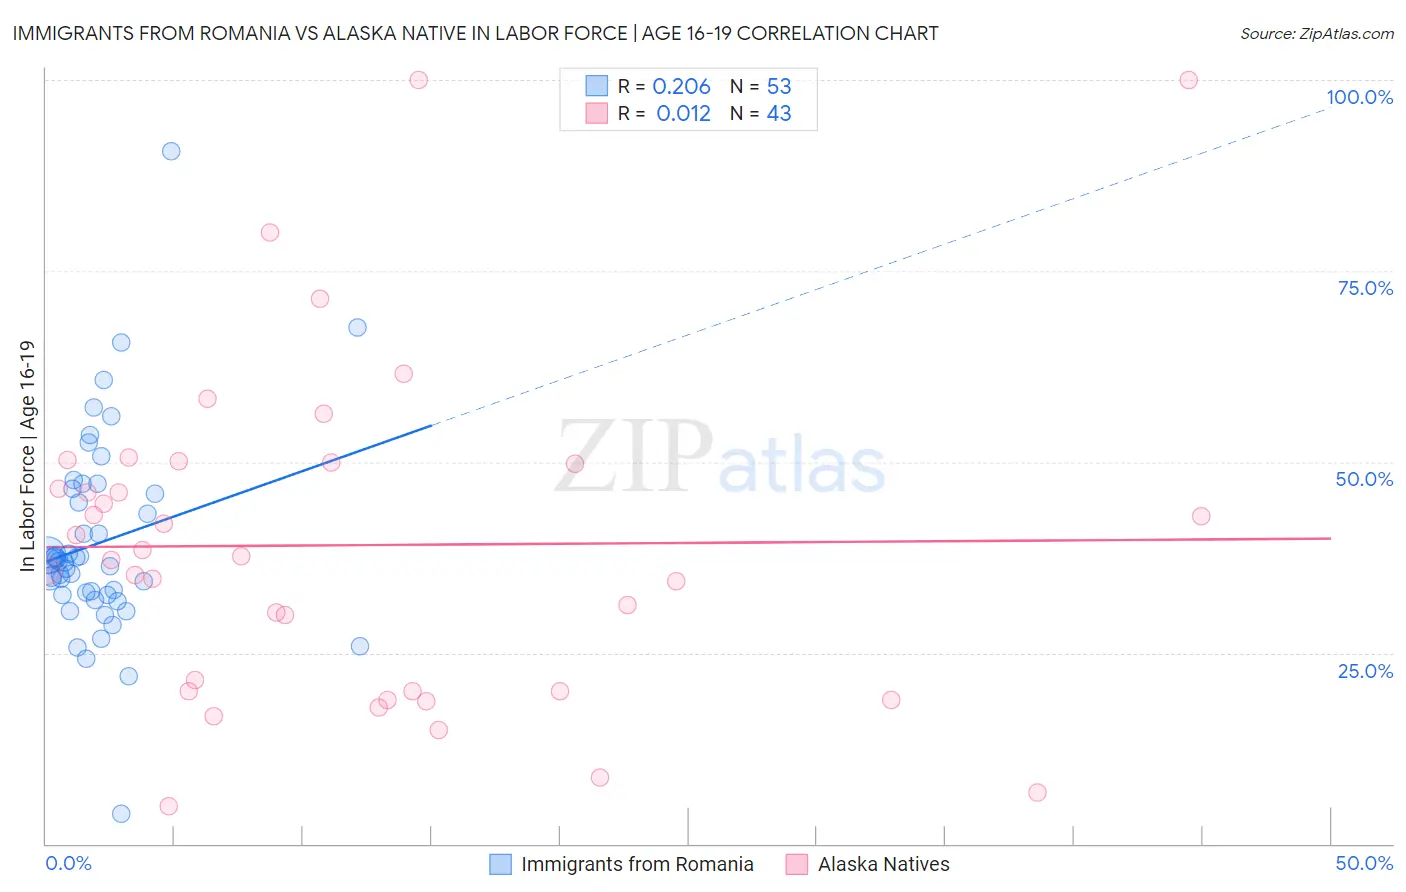
Immigrants from Romania vs Alaska Native In Labor Force | Age 16-19 Correlation Chart
The statistical analysis conducted on geographies consisting of 256,696,852 people shows a weak positive correlation between the proportion of Immigrants from Romania and labor force participation rate among population between the ages 16 and 19 in the United States with a correlation coefficient (R) of 0.206 and weighted average of 36.3%. Similarly, the statistical analysis conducted on geographies consisting of 76,723,647 people shows no correlation between the proportion of Alaska Natives and labor force participation rate among population between the ages 16 and 19 in the United States with a correlation coefficient (R) of 0.012 and weighted average of 39.1%, a difference of 7.8%.
In Labor Force | Age 16-19 Correlation Summary
| Measurement | Immigrants from Romania | Alaska Native |
| Minimum | 3.9% | 4.9% |
| Maximum | 90.6% | 100.0% |
| Range | 86.7% | 95.1% |
| Mean | 39.4% | 39.1% |
| Median | 37.0% | 37.6% |
| Interquartile 25% (IQ1) | 32.6% | 20.0% |
| Interquartile 75% (IQ3) | 46.1% | 50.0% |
| Interquartile Range (IQR) | 13.6% | 30.0% |
| Standard Deviation (Sample) | 13.3% | 21.7% |
| Standard Deviation (Population) | 13.2% | 21.4% |
Similar Demographics by In Labor Force | Age 16-19
Demographics Similar to Immigrants from Romania by In Labor Force | Age 16-19
In terms of in labor force | age 16-19, the demographic groups most similar to Immigrants from Romania are Immigrants from Afghanistan (36.3%, a difference of 0.0%), Bhutanese (36.3%, a difference of 0.070%), Costa Rican (36.3%, a difference of 0.12%), Immigrants from Europe (36.2%, a difference of 0.13%), and Eastern European (36.4%, a difference of 0.27%).
| Demographics | Rating | Rank | In Labor Force | Age 16-19 |
| Immigrants | Southern Europe | 43.3 /100 | #179 | Average 36.4% |
| Immigrants | Morocco | 41.1 /100 | #180 | Average 36.4% |
| Jordanians | 39.6 /100 | #181 | Fair 36.4% |
| Immigrants | Italy | 39.1 /100 | #182 | Fair 36.4% |
| Eastern Europeans | 38.8 /100 | #183 | Fair 36.4% |
| Costa Ricans | 36.1 /100 | #184 | Fair 36.3% |
| Bhutanese | 35.3 /100 | #185 | Fair 36.3% |
| Immigrants | Romania | 34.0 /100 | #186 | Fair 36.3% |
| Immigrants | Afghanistan | 34.0 /100 | #187 | Fair 36.3% |
| Immigrants | Europe | 31.8 /100 | #188 | Fair 36.2% |
| Immigrants | Hungary | 28.8 /100 | #189 | Fair 36.2% |
| Panamanians | 28.6 /100 | #190 | Fair 36.1% |
| Immigrants | Croatia | 27.5 /100 | #191 | Fair 36.1% |
| Afghans | 25.7 /100 | #192 | Fair 36.1% |
| Immigrants | Denmark | 25.0 /100 | #193 | Fair 36.1% |
Demographics Similar to Alaska Natives by In Labor Force | Age 16-19
In terms of in labor force | age 16-19, the demographic groups most similar to Alaska Natives are Puget Sound Salish (39.1%, a difference of 0.010%), Immigrants from Germany (39.1%, a difference of 0.080%), Immigrants from Burma/Myanmar (39.0%, a difference of 0.080%), Samoan (39.1%, a difference of 0.16%), and Creek (39.1%, a difference of 0.18%).
| Demographics | Rating | Rank | In Labor Force | Age 16-19 |
| Basques | 99.7 /100 | #82 | Exceptional 39.3% |
| Spanish | 99.7 /100 | #83 | Exceptional 39.3% |
| Immigrants | Uganda | 99.7 /100 | #84 | Exceptional 39.2% |
| Creek | 99.6 /100 | #85 | Exceptional 39.1% |
| Samoans | 99.6 /100 | #86 | Exceptional 39.1% |
| Immigrants | Germany | 99.6 /100 | #87 | Exceptional 39.1% |
| Puget Sound Salish | 99.6 /100 | #88 | Exceptional 39.1% |
| Alaska Natives | 99.6 /100 | #89 | Exceptional 39.1% |
| Immigrants | Burma/Myanmar | 99.5 /100 | #90 | Exceptional 39.0% |
| Spanish Americans | 99.5 /100 | #91 | Exceptional 39.0% |
| Osage | 99.4 /100 | #92 | Exceptional 39.0% |
| Blackfeet | 99.4 /100 | #93 | Exceptional 38.9% |
| Immigrants | Canada | 99.4 /100 | #94 | Exceptional 38.9% |
| Immigrants | North America | 99.4 /100 | #95 | Exceptional 38.9% |
| Latvians | 99.4 /100 | #96 | Exceptional 38.9% |