Immigrants from Philippines vs Immigrants from Laos In Labor Force | Age 20-64

COMPARE

Immigrants from Philippines
Race
Ancestry
AfghanAfricanAlaska NativeAlaskan AthabascanAlbanianAleutAlsatianAmericanApacheArabArapahoArgentineanArmenianAssyrian/Chaldean/SyriacAustralianAustrianBahamianBangladeshiBarbadianBasqueBelgianBelizeanBermudanBhutaneseBlackfeetBolivianBrazilianBritishBritish West IndianBulgarianBurmeseCajunCambodianCanadianCape VerdeanCarpatho RusynCelticCentral AmericanCentral American IndianCherokeeCheyenneChickasawChileanChineseChippewaChoctawColombianColvilleComancheCosta RicanCreeCreekCroatianCrowCubanCypriotCzechCzechoslovakianDanishDelawareDominicanDutchDutch West IndianEastern EuropeanEcuadorianEgyptianEnglishEstonianEthiopianEuropeanFijianFilipinoFinnishFrenchFrench American IndianFrench CanadianGermanGerman RussianGhanaianGreekGuamanian/ChamorroGuatemalanGuyaneseHaitianHmongHonduranHopiHoumaHungarianIcelanderIndian (Asian)IndonesianInupiatIranianIraqiIrishIroquoisIsraeliItalianJamaicanJapaneseJordanianKenyanKiowaKoreanLaotianLatvianLebaneseLiberianLithuanianLumbeeLuxembourgerMacedonianMalaysianMalteseMarshalleseMenomineeMexicanMexican American IndianMongolianMoroccanNative HawaiianNavajoNepaleseNew ZealanderNicaraguanNigerianNorthern EuropeanNorwegianOkinawanOsageOttawaPaiutePakistaniPalestinianPanamanianParaguayanPennsylvania GermanPeruvianPimaPolishPortuguesePotawatomiPuebloPuerto RicanPuget Sound SalishRomanianRussianSalvadoranSamoanScandinavianScotch-IrishScottishSeminoleSenegaleseSerbianShoshoneSierra LeoneanSiouxSlavicSlovakSloveneSomaliSouth AfricanSouth AmericanSouth American IndianSoviet UnionSpaniardSpanishSpanish AmericanSpanish American IndianSri LankanSubsaharan AfricanSudaneseSwedishSwissSyrianTaiwaneseThaiTlingit-HaidaTohono O'OdhamTonganTrinidadian and TobagonianTsimshianTurkishU.S. Virgin IslanderUgandanUkrainianUruguayanUteVenezuelanVietnameseWelshWest IndianYakamaYaquiYugoslavianYumanYup'ikZimbabwean
Immigration
NonimmigrantsImmigrantsAfghanistanAfricaAlbaniaArgentinaArmeniaAsiaAustraliaAustriaBahamasBangladeshBarbadosBelarusBelgiumBelizeBoliviaBosnia and HerzegovinaBrazilBulgariaBurma/MyanmarCabo VerdeCambodiaCameroonCanadaCaribbeanCentral AmericaChileChinaColombiaCongoCosta RicaCroatiaCubaCzechoslovakiaDenmarkDominicaDominican RepublicEastern AfricaEastern AsiaEastern EuropeEcuadorEgyptEl SalvadorEnglandEritreaEthiopiaEuropeFijiFranceGermanyGhanaGreeceGrenadaGuatemalaGuyanaHaitiHondurasHong KongHungaryIndiaIndonesiaIranIraqIrelandIsraelItalyJamaicaJapanJordanKazakhstanKenyaKoreaKuwaitLatin AmericaLatviaLebanonLiberiaLithuaniaMalaysiaMexicoMicronesiaMiddle AfricaMoldovaMoroccoNepalNetherlandsNicaraguaNigeriaNorth AmericaNorth MacedoniaNorthern AfricaNorthern EuropeNorwayOceaniaPakistanPanamaPeruPhilippinesPolandPortugalRomaniaRussiaSaudi ArabiaScotlandSenegalSerbiaSierra LeoneSingaporeSomaliaSouth AfricaSouth AmericaSouth Central AsiaSouth Eastern AsiaSouthern EuropeSpainSri LankaSt. Vincent and the GrenadinesSudanSwedenSwitzerlandSyriaTaiwanThailandTrinidad and TobagoTurkeyUgandaUkraineUruguayUzbekistanVenezuelaVietnamWest IndiesWestern AfricaWestern AsiaWestern EuropeYemenZaireZimbabweAzores
Immigrants from Laos
Race
Ancestry
AfghanAfricanAlaska NativeAlaskan AthabascanAlbanianAleutAlsatianAmericanApacheArabArapahoArgentineanArmenianAssyrian/Chaldean/SyriacAustralianAustrianBahamianBangladeshiBarbadianBasqueBelgianBelizeanBermudanBhutaneseBlackfeetBolivianBrazilianBritishBritish West IndianBulgarianBurmeseCajunCambodianCanadianCape VerdeanCarpatho RusynCelticCentral AmericanCentral American IndianCherokeeCheyenneChickasawChileanChineseChippewaChoctawColombianColvilleComancheCosta RicanCreeCreekCroatianCrowCubanCypriotCzechCzechoslovakianDanishDelawareDominicanDutchDutch West IndianEastern EuropeanEcuadorianEgyptianEnglishEstonianEthiopianEuropeanFijianFilipinoFinnishFrenchFrench American IndianFrench CanadianGermanGerman RussianGhanaianGreekGuamanian/ChamorroGuatemalanGuyaneseHaitianHmongHonduranHopiHoumaHungarianIcelanderIndian (Asian)IndonesianInupiatIranianIraqiIrishIroquoisIsraeliItalianJamaicanJapaneseJordanianKenyanKiowaKoreanLaotianLatvianLebaneseLiberianLithuanianLumbeeLuxembourgerMacedonianMalaysianMalteseMarshalleseMenomineeMexicanMexican American IndianMongolianMoroccanNative HawaiianNavajoNepaleseNew ZealanderNicaraguanNigerianNorthern EuropeanNorwegianOkinawanOsageOttawaPaiutePakistaniPalestinianPanamanianParaguayanPennsylvania GermanPeruvianPimaPolishPortuguesePotawatomiPuebloPuerto RicanPuget Sound SalishRomanianRussianSalvadoranSamoanScandinavianScotch-IrishScottishSeminoleSenegaleseSerbianShoshoneSierra LeoneanSiouxSlavicSlovakSloveneSomaliSouth AfricanSouth AmericanSouth American IndianSoviet UnionSpaniardSpanishSpanish AmericanSpanish American IndianSri LankanSubsaharan AfricanSudaneseSwedishSwissSyrianTaiwaneseThaiTlingit-HaidaTohono O'OdhamTonganTrinidadian and TobagonianTsimshianTurkishU.S. Virgin IslanderUgandanUkrainianUruguayanUteVenezuelanVietnameseWelshWest IndianYakamaYaquiYugoslavianYumanYup'ikZimbabwean
Immigration
NonimmigrantsImmigrantsAfghanistanAfricaAlbaniaArgentinaArmeniaAsiaAustraliaAustriaBahamasBangladeshBarbadosBelarusBelgiumBelizeBoliviaBosnia and HerzegovinaBrazilBulgariaBurma/MyanmarCabo VerdeCambodiaCameroonCanadaCaribbeanCentral AmericaChileChinaColombiaCongoCosta RicaCroatiaCubaCzechoslovakiaDenmarkDominicaDominican RepublicEastern AfricaEastern AsiaEastern EuropeEcuadorEgyptEl SalvadorEnglandEritreaEthiopiaEuropeFijiFranceGermanyGhanaGreeceGrenadaGuatemalaGuyanaHaitiHondurasHong KongHungaryIndiaIndonesiaIranIraqIrelandIsraelItalyJamaicaJapanJordanKazakhstanKenyaKoreaKuwaitLaosLatin AmericaLatviaLebanonLiberiaLithuaniaMalaysiaMexicoMicronesiaMiddle AfricaMoldovaMoroccoNepalNetherlandsNicaraguaNigeriaNorth AmericaNorth MacedoniaNorthern AfricaNorthern EuropeNorwayOceaniaPakistanPanamaPeruPolandPortugalRomaniaRussiaSaudi ArabiaScotlandSenegalSerbiaSierra LeoneSingaporeSomaliaSouth AfricaSouth AmericaSouth Central AsiaSouth Eastern AsiaSouthern EuropeSpainSri LankaSt. Vincent and the GrenadinesSudanSwedenSwitzerlandSyriaTaiwanThailandTrinidad and TobagoTurkeyUgandaUkraineUruguayUzbekistanVenezuelaVietnamWest IndiesWestern AfricaWestern AsiaWestern EuropeYemenZaireZimbabweAzores
In Labor Force | Age 20-64
Income
Poverty
Unemployment
Labor Participation
Family Structure
Vehicle Availability
Education Level
Disability

In Labor Force | Age 20-64 Comparison

Immigrants from Philippines

Immigrants from Laos

Good
Fair
79.8%
IN LABOR FORCE | AGE 20-64
78.0/ 100
METRIC RATING
147th/ 347
METRIC RANK
79.4%
IN LABOR FORCE | AGE 20-64
21.5/ 100
METRIC RATING
198th/ 347
METRIC RANK

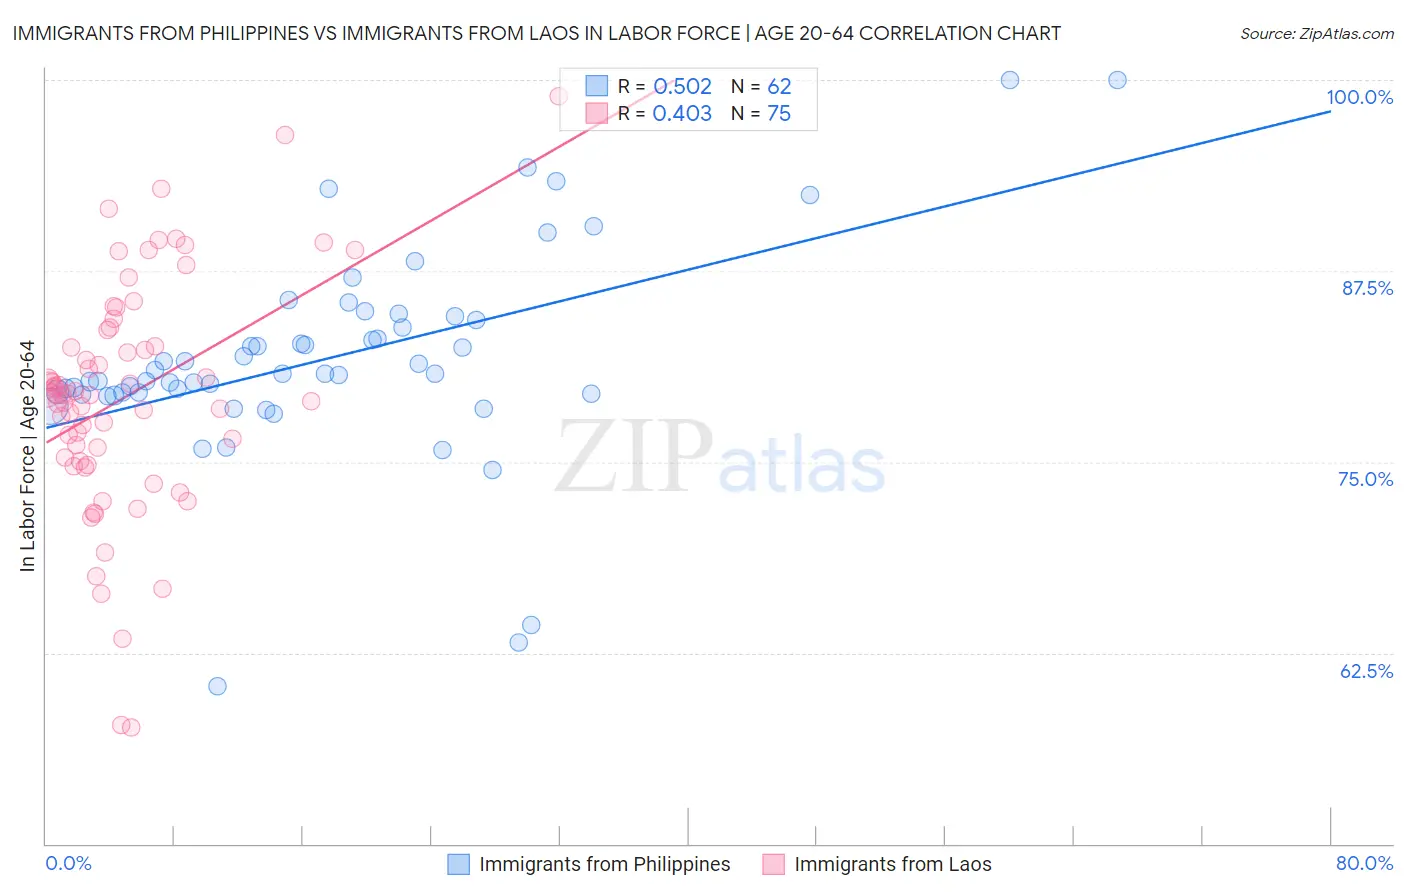
Immigrants from Philippines vs Immigrants from Laos In Labor Force | Age 20-64 Correlation Chart

The statistical analysis conducted on geographies consisting of 471,289,372 people shows a substantial positive correlation between the proportion of Immigrants from Philippines and labor force participation rate among population between the ages 20 and 64 in the United States with a correlation coefficient (R) of 0.502 and weighted average of 79.8%. Similarly, the statistical analysis conducted on geographies consisting of 201,472,341 people shows a moderate positive correlation between the proportion of Immigrants from Laos and labor force participation rate among population between the ages 20 and 64 in the United States with a correlation coefficient (R) of 0.403 and weighted average of 79.4%, a difference of 0.52%.
Immigrants from Philippines vs Immigrants from Laos In Labor Force | Age 20-64

In Labor Force | Age 20-64 Correlation Summary

MeasurementImmigrants from PhilippinesImmigrants from Laos
Minimum60.3%57.6%
Maximum100.0%98.9%
Range39.7%41.3%
Mean81.8%79.3%
Median80.8%79.4%
Interquartile 25% (IQ1)79.5%75.1%
Interquartile 75% (IQ3)84.3%83.6%
Interquartile Range (IQR)4.8%8.5%
Standard Deviation (Sample)6.9%7.7%
Standard Deviation (Population)6.8%7.6%

Similar Demographics by In Labor Force | Age 20-64

Demographics Similar to Immigrants from Philippines by In Labor Force | Age 20-64

In terms of in labor force | age 20-64, the demographic groups most similar to Immigrants from Philippines are Romanian (79.8%, a difference of 0.0%), Immigrants from Southern Europe (79.8%, a difference of 0.010%), Immigrants from Israel (79.8%, a difference of 0.020%), Slovak (79.8%, a difference of 0.020%), and Immigrants from Sweden (79.8%, a difference of 0.020%).
DemographicsRating | RankIn Labor Force | Age 20-64
Immigrants | South Eastern Asia
80.4
/100
|
#140
Excellent
79.8%
Immigrants | Israel
80.0
/100
|
#141
Good
79.8%
Slovaks
79.9
/100
|
#142
Good
79.8%
Immigrants | Sweden
79.7
/100
|
#143
Good
79.8%
Koreans
79.6
/100
|
#144
Good
79.8%
Pakistanis
79.3
/100
|
#145
Good
79.8%
Immigrants | Southern Europe
78.9
/100
|
#146
Good
79.8%
Immigrants | Philippines
78.0
/100
|
#147
Good
79.8%
Romanians
77.6
/100
|
#148
Good
79.8%
Icelanders
75.1
/100
|
#149
Good
79.7%
Costa Ricans
72.4
/100
|
#150
Good
79.7%
Scandinavians
72.0
/100
|
#151
Good
79.7%
Immigrants | Northern Europe
72.0
/100
|
#152
Good
79.7%
Immigrants | Kazakhstan
69.5
/100
|
#153
Good
79.7%
New Zealanders
69.4
/100
|
#154
Good
79.7%

Demographics Similar to Immigrants from Laos by In Labor Force | Age 20-64

In terms of in labor force | age 20-64, the demographic groups most similar to Immigrants from Laos are Immigrants from Senegal (79.4%, a difference of 0.010%), Ecuadorian (79.4%, a difference of 0.020%), Dutch (79.3%, a difference of 0.020%), Immigrants from Austria (79.4%, a difference of 0.030%), and Immigrants from Oceania (79.3%, a difference of 0.030%).
DemographicsRating | RankIn Labor Force | Age 20-64
Swiss
28.9
/100
|
#191
Fair
79.4%
Immigrants | Denmark
26.9
/100
|
#192
Fair
79.4%
Indonesians
26.1
/100
|
#193
Fair
79.4%
Immigrants | Thailand
24.8
/100
|
#194
Fair
79.4%
Immigrants | Austria
23.7
/100
|
#195
Fair
79.4%
Ecuadorians
23.1
/100
|
#196
Fair
79.4%
Immigrants | Senegal
22.5
/100
|
#197
Fair
79.4%
Immigrants | Laos
21.5
/100
|
#198
Fair
79.4%
Dutch
20.2
/100
|
#199
Fair
79.3%
Immigrants | Oceania
19.1
/100
|
#200
Poor
79.3%
Immigrants | Nicaragua
19.0
/100
|
#201
Poor
79.3%
Nicaraguans
18.3
/100
|
#202
Poor
79.3%
Iraqis
17.7
/100
|
#203
Poor
79.3%
Immigrants | Cambodia
17.6
/100
|
#204
Poor
79.3%
Immigrants | Congo
17.5
/100
|
#205
Poor
79.3%