Immigrants from Philippines vs Immigrants from Cambodia In Labor Force | Age 20-64
COMPARE
Immigrants from Philippines
Immigrants from Cambodia
In Labor Force | Age 20-64
In Labor Force | Age 20-64 Comparison
Immigrants from Philippines
Immigrants from Cambodia
79.8%
IN LABOR FORCE | AGE 20-64
78.0/ 100
METRIC RATING
147th/ 347
METRIC RANK
79.3%
IN LABOR FORCE | AGE 20-64
17.6/ 100
METRIC RATING
204th/ 347
METRIC RANK
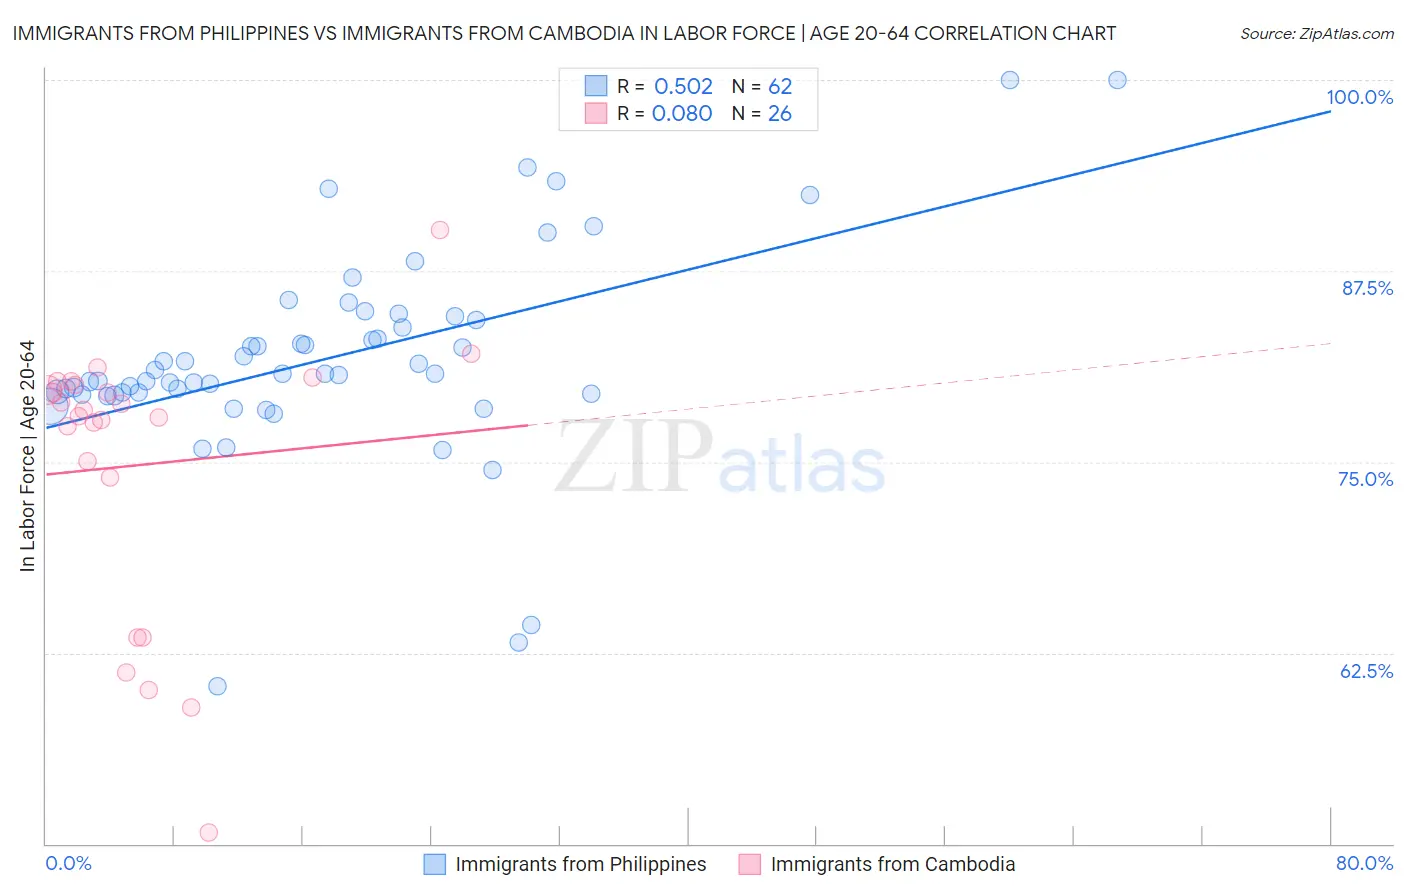
Immigrants from Philippines vs Immigrants from Cambodia In Labor Force | Age 20-64 Correlation Chart
The statistical analysis conducted on geographies consisting of 471,289,372 people shows a substantial positive correlation between the proportion of Immigrants from Philippines and labor force participation rate among population between the ages 20 and 64 in the United States with a correlation coefficient (R) of 0.502 and weighted average of 79.8%. Similarly, the statistical analysis conducted on geographies consisting of 205,155,425 people shows a slight positive correlation between the proportion of Immigrants from Cambodia and labor force participation rate among population between the ages 20 and 64 in the United States with a correlation coefficient (R) of 0.080 and weighted average of 79.3%, a difference of 0.57%.
In Labor Force | Age 20-64 Correlation Summary
| Measurement | Immigrants from Philippines | Immigrants from Cambodia |
| Minimum | 60.3% | 50.7% |
| Maximum | 100.0% | 90.2% |
| Range | 39.7% | 39.5% |
| Mean | 81.8% | 74.8% |
| Median | 80.8% | 78.2% |
| Interquartile 25% (IQ1) | 79.5% | 74.0% |
| Interquartile 75% (IQ3) | 84.3% | 80.1% |
| Interquartile Range (IQR) | 4.8% | 6.1% |
| Standard Deviation (Sample) | 6.9% | 9.2% |
| Standard Deviation (Population) | 6.8% | 9.0% |
Similar Demographics by In Labor Force | Age 20-64
Demographics Similar to Immigrants from Philippines by In Labor Force | Age 20-64
In terms of in labor force | age 20-64, the demographic groups most similar to Immigrants from Philippines are Romanian (79.8%, a difference of 0.0%), Immigrants from Southern Europe (79.8%, a difference of 0.010%), Immigrants from Israel (79.8%, a difference of 0.020%), Slovak (79.8%, a difference of 0.020%), and Immigrants from Sweden (79.8%, a difference of 0.020%).
| Demographics | Rating | Rank | In Labor Force | Age 20-64 |
| Immigrants | South Eastern Asia | 80.4 /100 | #140 | Excellent 79.8% |
| Immigrants | Israel | 80.0 /100 | #141 | Good 79.8% |
| Slovaks | 79.9 /100 | #142 | Good 79.8% |
| Immigrants | Sweden | 79.7 /100 | #143 | Good 79.8% |
| Koreans | 79.6 /100 | #144 | Good 79.8% |
| Pakistanis | 79.3 /100 | #145 | Good 79.8% |
| Immigrants | Southern Europe | 78.9 /100 | #146 | Good 79.8% |
| Immigrants | Philippines | 78.0 /100 | #147 | Good 79.8% |
| Romanians | 77.6 /100 | #148 | Good 79.8% |
| Icelanders | 75.1 /100 | #149 | Good 79.7% |
| Costa Ricans | 72.4 /100 | #150 | Good 79.7% |
| Scandinavians | 72.0 /100 | #151 | Good 79.7% |
| Immigrants | Northern Europe | 72.0 /100 | #152 | Good 79.7% |
| Immigrants | Kazakhstan | 69.5 /100 | #153 | Good 79.7% |
| New Zealanders | 69.4 /100 | #154 | Good 79.7% |
Demographics Similar to Immigrants from Cambodia by In Labor Force | Age 20-64
In terms of in labor force | age 20-64, the demographic groups most similar to Immigrants from Cambodia are Iraqi (79.3%, a difference of 0.0%), Immigrants from Congo (79.3%, a difference of 0.0%), Nicaraguan (79.3%, a difference of 0.010%), Immigrants from Ecuador (79.3%, a difference of 0.010%), and Immigrants from Oceania (79.3%, a difference of 0.020%).
| Demographics | Rating | Rank | In Labor Force | Age 20-64 |
| Immigrants | Senegal | 22.5 /100 | #197 | Fair 79.4% |
| Immigrants | Laos | 21.5 /100 | #198 | Fair 79.4% |
| Dutch | 20.2 /100 | #199 | Fair 79.3% |
| Immigrants | Oceania | 19.1 /100 | #200 | Poor 79.3% |
| Immigrants | Nicaragua | 19.0 /100 | #201 | Poor 79.3% |
| Nicaraguans | 18.3 /100 | #202 | Poor 79.3% |
| Iraqis | 17.7 /100 | #203 | Poor 79.3% |
| Immigrants | Cambodia | 17.6 /100 | #204 | Poor 79.3% |
| Immigrants | Congo | 17.5 /100 | #205 | Poor 79.3% |
| Immigrants | Ecuador | 16.9 /100 | #206 | Poor 79.3% |
| Sub-Saharan Africans | 16.5 /100 | #207 | Poor 79.3% |
| British | 16.5 /100 | #208 | Poor 79.3% |
| Bangladeshis | 16.4 /100 | #209 | Poor 79.3% |
| Haitians | 16.1 /100 | #210 | Poor 79.3% |
| Europeans | 15.3 /100 | #211 | Poor 79.3% |