Immigrants from Philippines vs Venezuelan In Labor Force | Age 20-24
COMPARE
Immigrants from Philippines
Venezuelan
In Labor Force | Age 20-24
In Labor Force | Age 20-24 Comparison
Immigrants from Philippines
Venezuelans
75.1%
IN LABOR FORCE | AGE 20-24
55.8/ 100
METRIC RATING
169th/ 347
METRIC RANK
73.3%
IN LABOR FORCE | AGE 20-24
0.2/ 100
METRIC RATING
279th/ 347
METRIC RANK
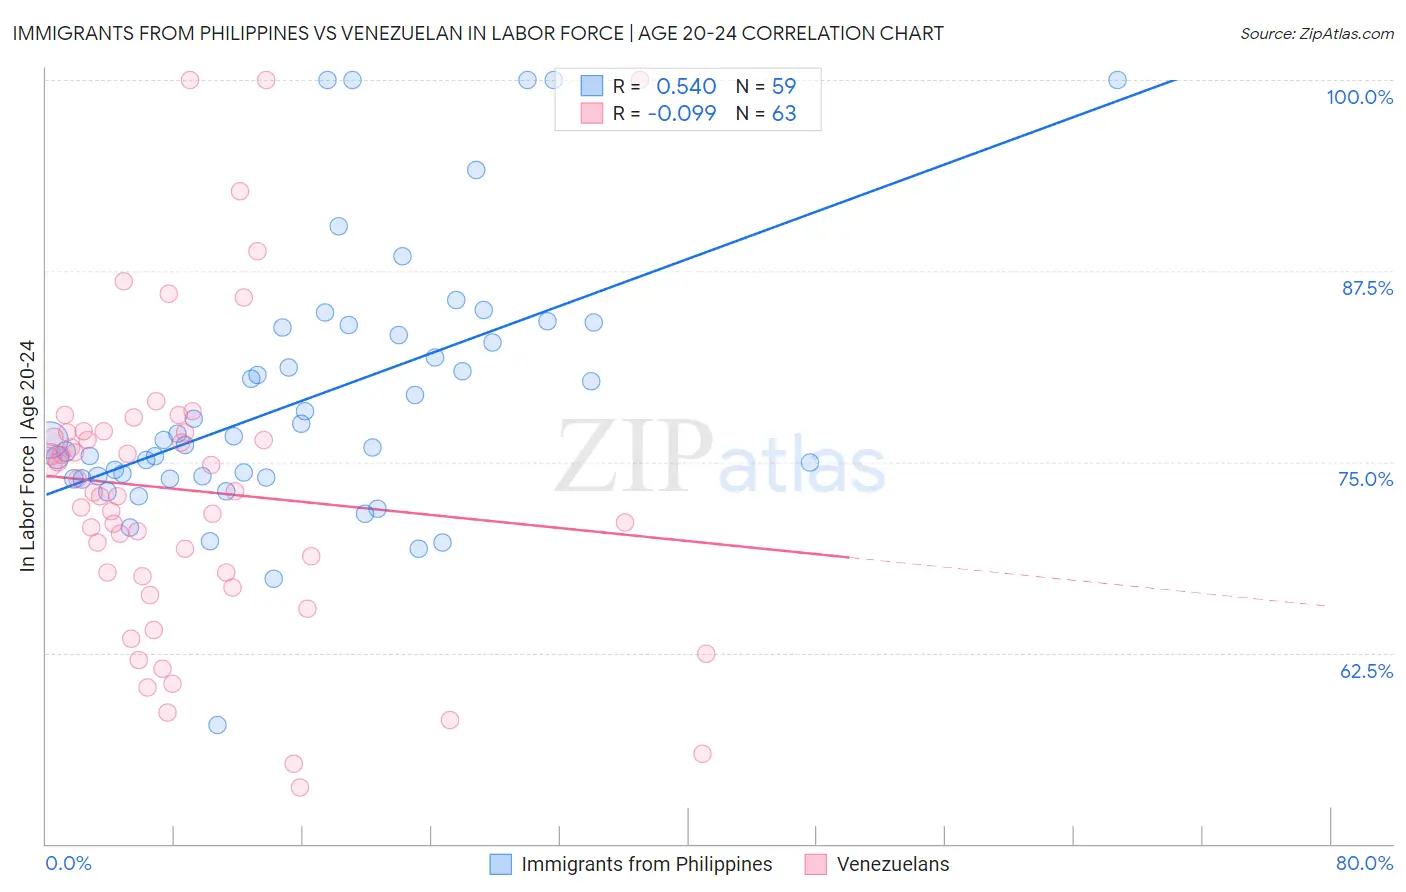
Immigrants from Philippines vs Venezuelan In Labor Force | Age 20-24 Correlation Chart
The statistical analysis conducted on geographies consisting of 470,994,920 people shows a substantial positive correlation between the proportion of Immigrants from Philippines and labor force participation rate among population between the ages 20 and 24 in the United States with a correlation coefficient (R) of 0.540 and weighted average of 75.1%. Similarly, the statistical analysis conducted on geographies consisting of 306,312,696 people shows a slight negative correlation between the proportion of Venezuelans and labor force participation rate among population between the ages 20 and 24 in the United States with a correlation coefficient (R) of -0.099 and weighted average of 73.3%, a difference of 2.5%.
In Labor Force | Age 20-24 Correlation Summary
| Measurement | Immigrants from Philippines | Venezuelan |
| Minimum | 57.8% | 53.7% |
| Maximum | 100.0% | 100.0% |
| Range | 42.2% | 46.3% |
| Mean | 79.2% | 73.1% |
| Median | 76.5% | 73.0% |
| Interquartile 25% (IQ1) | 74.0% | 67.5% |
| Interquartile 75% (IQ3) | 83.8% | 76.9% |
| Interquartile Range (IQR) | 9.8% | 9.4% |
| Standard Deviation (Sample) | 8.7% | 10.0% |
| Standard Deviation (Population) | 8.6% | 9.9% |
Similar Demographics by In Labor Force | Age 20-24
Demographics Similar to Immigrants from Philippines by In Labor Force | Age 20-24
In terms of in labor force | age 20-24, the demographic groups most similar to Immigrants from Philippines are Immigrants from Western Africa (75.1%, a difference of 0.010%), Immigrants from South Eastern Asia (75.1%, a difference of 0.030%), Mexican (75.1%, a difference of 0.050%), Cambodian (75.2%, a difference of 0.070%), and Cajun (75.1%, a difference of 0.070%).
| Demographics | Rating | Rank | In Labor Force | Age 20-24 |
| Immigrants | Romania | 64.6 /100 | #162 | Good 75.2% |
| Costa Ricans | 64.2 /100 | #163 | Good 75.2% |
| Bolivians | 64.0 /100 | #164 | Good 75.2% |
| Afghans | 63.5 /100 | #165 | Good 75.2% |
| Cambodians | 60.5 /100 | #166 | Good 75.2% |
| Immigrants | South Eastern Asia | 57.5 /100 | #167 | Average 75.1% |
| Immigrants | Western Africa | 56.7 /100 | #168 | Average 75.1% |
| Immigrants | Philippines | 55.8 /100 | #169 | Average 75.1% |
| Mexicans | 52.1 /100 | #170 | Average 75.1% |
| Cajuns | 51.1 /100 | #171 | Average 75.1% |
| Yakama | 50.8 /100 | #172 | Average 75.1% |
| Immigrants | Croatia | 50.2 /100 | #173 | Average 75.1% |
| South Africans | 50.0 /100 | #174 | Average 75.0% |
| Syrians | 49.5 /100 | #175 | Average 75.0% |
| Central Americans | 48.7 /100 | #176 | Average 75.0% |
Demographics Similar to Venezuelans by In Labor Force | Age 20-24
In terms of in labor force | age 20-24, the demographic groups most similar to Venezuelans are Cypriot (73.3%, a difference of 0.010%), Mongolian (73.3%, a difference of 0.030%), Immigrants from Malaysia (73.3%, a difference of 0.030%), Immigrants from South America (73.3%, a difference of 0.050%), and Bahamian (73.3%, a difference of 0.070%).
| Demographics | Rating | Rank | In Labor Force | Age 20-24 |
| Belizeans | 0.3 /100 | #272 | Tragic 73.4% |
| Cheyenne | 0.2 /100 | #273 | Tragic 73.4% |
| Immigrants | Colombia | 0.2 /100 | #274 | Tragic 73.4% |
| Immigrants | South America | 0.2 /100 | #275 | Tragic 73.3% |
| Mongolians | 0.2 /100 | #276 | Tragic 73.3% |
| Immigrants | Malaysia | 0.2 /100 | #277 | Tragic 73.3% |
| Cypriots | 0.2 /100 | #278 | Tragic 73.3% |
| Venezuelans | 0.2 /100 | #279 | Tragic 73.3% |
| Bahamians | 0.1 /100 | #280 | Tragic 73.3% |
| Immigrants | Venezuela | 0.1 /100 | #281 | Tragic 73.2% |
| Immigrants | Spain | 0.1 /100 | #282 | Tragic 73.2% |
| Immigrants | Bahamas | 0.1 /100 | #283 | Tragic 73.2% |
| Kiowa | 0.1 /100 | #284 | Tragic 73.2% |
| Nicaraguans | 0.1 /100 | #285 | Tragic 73.2% |
| Immigrants | Lebanon | 0.1 /100 | #286 | Tragic 73.1% |