Guatemalan vs Immigrants from Laos In Labor Force | Age 20-64
COMPARE
Guatemalan
Immigrants from Laos
In Labor Force | Age 20-64
In Labor Force | Age 20-64 Comparison
Guatemalans
Immigrants from Laos
78.7%
IN LABOR FORCE | AGE 20-64
0.4/ 100
METRIC RATING
257th/ 347
METRIC RANK
79.4%
IN LABOR FORCE | AGE 20-64
21.5/ 100
METRIC RATING
198th/ 347
METRIC RANK
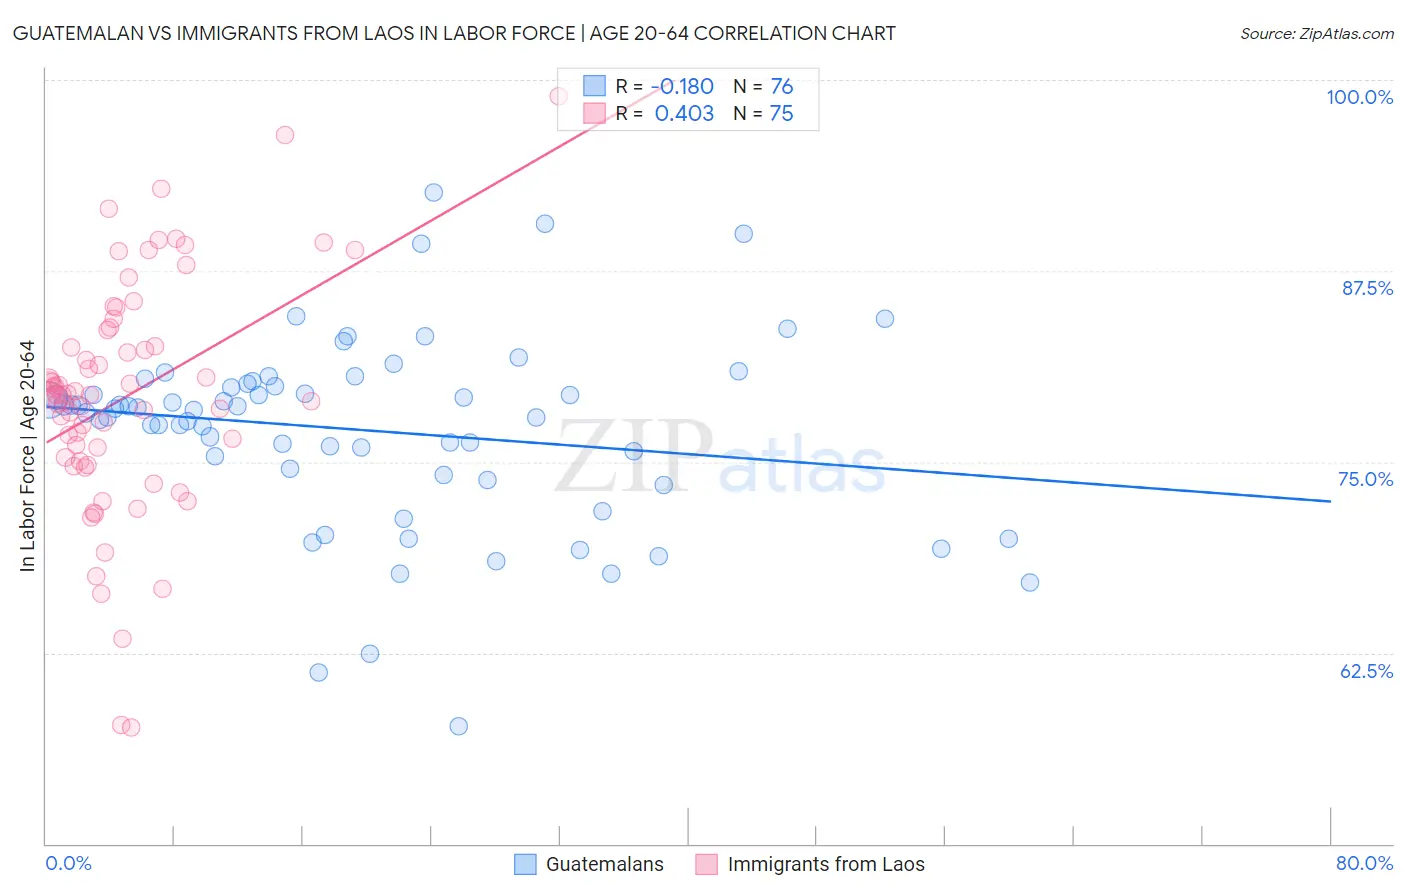
Guatemalan vs Immigrants from Laos In Labor Force | Age 20-64 Correlation Chart
The statistical analysis conducted on geographies consisting of 409,569,156 people shows a poor negative correlation between the proportion of Guatemalans and labor force participation rate among population between the ages 20 and 64 in the United States with a correlation coefficient (R) of -0.180 and weighted average of 78.7%. Similarly, the statistical analysis conducted on geographies consisting of 201,472,341 people shows a moderate positive correlation between the proportion of Immigrants from Laos and labor force participation rate among population between the ages 20 and 64 in the United States with a correlation coefficient (R) of 0.403 and weighted average of 79.4%, a difference of 0.83%.
In Labor Force | Age 20-64 Correlation Summary
| Measurement | Guatemalan | Immigrants from Laos |
| Minimum | 57.7% | 57.6% |
| Maximum | 92.6% | 98.9% |
| Range | 34.9% | 41.3% |
| Mean | 77.1% | 79.3% |
| Median | 78.4% | 79.4% |
| Interquartile 25% (IQ1) | 74.4% | 75.1% |
| Interquartile 75% (IQ3) | 80.0% | 83.6% |
| Interquartile Range (IQR) | 5.7% | 8.5% |
| Standard Deviation (Sample) | 6.2% | 7.7% |
| Standard Deviation (Population) | 6.2% | 7.6% |
Similar Demographics by In Labor Force | Age 20-64
Demographics Similar to Guatemalans by In Labor Force | Age 20-64
In terms of in labor force | age 20-64, the demographic groups most similar to Guatemalans are Immigrants from Guatemala (78.7%, a difference of 0.0%), Hawaiian (78.7%, a difference of 0.020%), Celtic (78.7%, a difference of 0.020%), Basque (78.7%, a difference of 0.040%), and Immigrants from Lebanon (78.7%, a difference of 0.040%).
| Demographics | Rating | Rank | In Labor Force | Age 20-64 |
| Hondurans | 0.8 /100 | #250 | Tragic 78.8% |
| Barbadians | 0.7 /100 | #251 | Tragic 78.8% |
| Immigrants | Honduras | 0.6 /100 | #252 | Tragic 78.7% |
| Basques | 0.5 /100 | #253 | Tragic 78.7% |
| Immigrants | Lebanon | 0.5 /100 | #254 | Tragic 78.7% |
| Hawaiians | 0.5 /100 | #255 | Tragic 78.7% |
| Celtics | 0.5 /100 | #256 | Tragic 78.7% |
| Guatemalans | 0.4 /100 | #257 | Tragic 78.7% |
| Immigrants | Guatemala | 0.4 /100 | #258 | Tragic 78.7% |
| Tsimshian | 0.4 /100 | #259 | Tragic 78.7% |
| Immigrants | Fiji | 0.3 /100 | #260 | Tragic 78.6% |
| Whites/Caucasians | 0.2 /100 | #261 | Tragic 78.5% |
| Fijians | 0.1 /100 | #262 | Tragic 78.4% |
| Pennsylvania Germans | 0.1 /100 | #263 | Tragic 78.4% |
| Spaniards | 0.1 /100 | #264 | Tragic 78.4% |
Demographics Similar to Immigrants from Laos by In Labor Force | Age 20-64
In terms of in labor force | age 20-64, the demographic groups most similar to Immigrants from Laos are Immigrants from Senegal (79.4%, a difference of 0.010%), Ecuadorian (79.4%, a difference of 0.020%), Dutch (79.3%, a difference of 0.020%), Immigrants from Austria (79.4%, a difference of 0.030%), and Immigrants from Oceania (79.3%, a difference of 0.030%).
| Demographics | Rating | Rank | In Labor Force | Age 20-64 |
| Swiss | 28.9 /100 | #191 | Fair 79.4% |
| Immigrants | Denmark | 26.9 /100 | #192 | Fair 79.4% |
| Indonesians | 26.1 /100 | #193 | Fair 79.4% |
| Immigrants | Thailand | 24.8 /100 | #194 | Fair 79.4% |
| Immigrants | Austria | 23.7 /100 | #195 | Fair 79.4% |
| Ecuadorians | 23.1 /100 | #196 | Fair 79.4% |
| Immigrants | Senegal | 22.5 /100 | #197 | Fair 79.4% |
| Immigrants | Laos | 21.5 /100 | #198 | Fair 79.4% |
| Dutch | 20.2 /100 | #199 | Fair 79.3% |
| Immigrants | Oceania | 19.1 /100 | #200 | Poor 79.3% |
| Immigrants | Nicaragua | 19.0 /100 | #201 | Poor 79.3% |
| Nicaraguans | 18.3 /100 | #202 | Poor 79.3% |
| Iraqis | 17.7 /100 | #203 | Poor 79.3% |
| Immigrants | Cambodia | 17.6 /100 | #204 | Poor 79.3% |
| Immigrants | Congo | 17.5 /100 | #205 | Poor 79.3% |