South American Indian vs Polish In Labor Force | Age 45-54
COMPARE
South American Indian
Polish
In Labor Force | Age 45-54
In Labor Force | Age 45-54 Comparison
South American Indians
Poles
82.9%
IN LABOR FORCE | AGE 45-54
62.2/ 100
METRIC RATING
161st/ 347
METRIC RANK
83.6%
IN LABOR FORCE | AGE 45-54
98.7/ 100
METRIC RATING
52nd/ 347
METRIC RANK
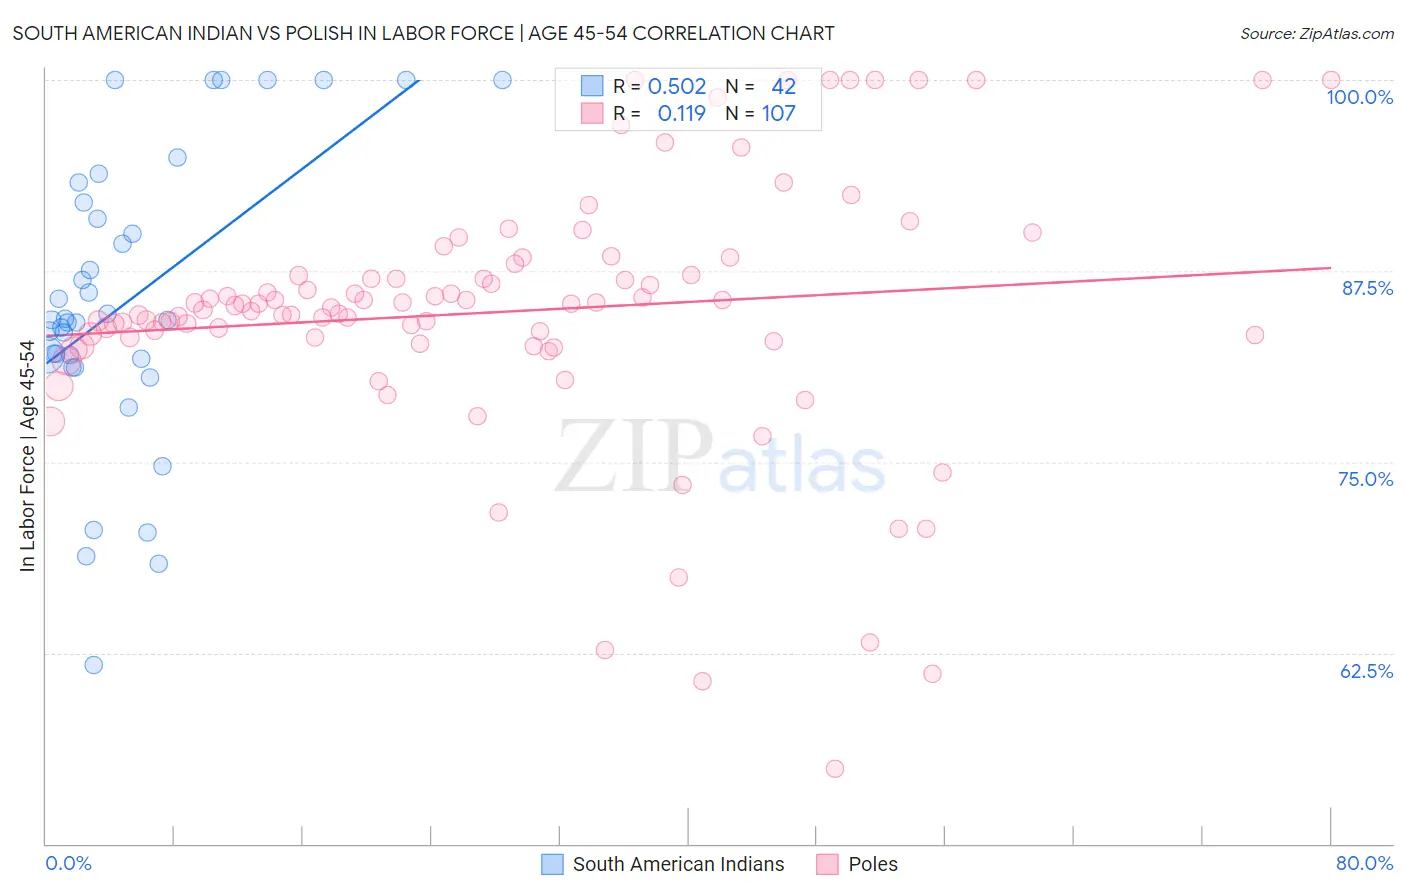
South American Indian vs Polish In Labor Force | Age 45-54 Correlation Chart
The statistical analysis conducted on geographies consisting of 164,535,706 people shows a substantial positive correlation between the proportion of South American Indians and labor force participation rate among population between the ages 45 and 54 in the United States with a correlation coefficient (R) of 0.502 and weighted average of 82.9%. Similarly, the statistical analysis conducted on geographies consisting of 559,827,067 people shows a poor positive correlation between the proportion of Poles and labor force participation rate among population between the ages 45 and 54 in the United States with a correlation coefficient (R) of 0.119 and weighted average of 83.6%, a difference of 0.85%.
In Labor Force | Age 45-54 Correlation Summary
| Measurement | South American Indian | Polish |
| Minimum | 61.7% | 54.9% |
| Maximum | 100.0% | 100.0% |
| Range | 38.3% | 45.1% |
| Mean | 85.5% | 84.8% |
| Median | 84.3% | 85.1% |
| Interquartile 25% (IQ1) | 81.7% | 82.9% |
| Interquartile 75% (IQ3) | 91.9% | 87.2% |
| Interquartile Range (IQR) | 10.2% | 4.3% |
| Standard Deviation (Sample) | 9.5% | 8.5% |
| Standard Deviation (Population) | 9.4% | 8.4% |
Similar Demographics by In Labor Force | Age 45-54
Demographics Similar to South American Indians by In Labor Force | Age 45-54
In terms of in labor force | age 45-54, the demographic groups most similar to South American Indians are Haitian (82.8%, a difference of 0.0%), Dutch (82.8%, a difference of 0.0%), Laotian (82.9%, a difference of 0.010%), German Russian (82.8%, a difference of 0.010%), and Immigrants from Austria (82.9%, a difference of 0.020%).
| Demographics | Rating | Rank | In Labor Force | Age 45-54 |
| Immigrants | Ghana | 70.3 /100 | #154 | Good 82.9% |
| Immigrants | Philippines | 69.0 /100 | #155 | Good 82.9% |
| Immigrants | Saudi Arabia | 68.8 /100 | #156 | Good 82.9% |
| Immigrants | Australia | 68.2 /100 | #157 | Good 82.9% |
| Immigrants | Southern Europe | 67.8 /100 | #158 | Good 82.9% |
| Immigrants | Austria | 64.6 /100 | #159 | Good 82.9% |
| Laotians | 62.8 /100 | #160 | Good 82.9% |
| South American Indians | 62.2 /100 | #161 | Good 82.9% |
| Haitians | 61.8 /100 | #162 | Good 82.8% |
| Dutch | 61.7 /100 | #163 | Good 82.8% |
| German Russians | 61.3 /100 | #164 | Good 82.8% |
| Immigrants | Sudan | 59.9 /100 | #165 | Average 82.8% |
| Immigrants | South Eastern Asia | 57.4 /100 | #166 | Average 82.8% |
| Swiss | 56.5 /100 | #167 | Average 82.8% |
| Immigrants | South Africa | 55.8 /100 | #168 | Average 82.8% |
Demographics Similar to Poles by In Labor Force | Age 45-54
In terms of in labor force | age 45-54, the demographic groups most similar to Poles are Immigrants from Turkey (83.6%, a difference of 0.0%), Peruvian (83.6%, a difference of 0.0%), Immigrants from Greece (83.6%, a difference of 0.010%), Somali (83.5%, a difference of 0.010%), and Macedonian (83.5%, a difference of 0.020%).
| Demographics | Rating | Rank | In Labor Force | Age 45-54 |
| Immigrants | Hong Kong | 99.1 /100 | #45 | Exceptional 83.6% |
| Lithuanians | 99.1 /100 | #46 | Exceptional 83.6% |
| Croatians | 99.0 /100 | #47 | Exceptional 83.6% |
| Immigrants | Poland | 99.0 /100 | #48 | Exceptional 83.6% |
| Immigrants | Morocco | 99.0 /100 | #49 | Exceptional 83.6% |
| Immigrants | Greece | 98.8 /100 | #50 | Exceptional 83.6% |
| Immigrants | Turkey | 98.8 /100 | #51 | Exceptional 83.6% |
| Poles | 98.7 /100 | #52 | Exceptional 83.6% |
| Peruvians | 98.7 /100 | #53 | Exceptional 83.6% |
| Somalis | 98.7 /100 | #54 | Exceptional 83.5% |
| Macedonians | 98.7 /100 | #55 | Exceptional 83.5% |
| Immigrants | Peru | 98.6 /100 | #56 | Exceptional 83.5% |
| Paraguayans | 98.5 /100 | #57 | Exceptional 83.5% |
| Eastern Europeans | 98.5 /100 | #58 | Exceptional 83.5% |
| Bhutanese | 98.3 /100 | #59 | Exceptional 83.5% |