Immigrants from Panama vs Austrian In Labor Force | Age 30-34
COMPARE
Immigrants from Panama
Austrian
In Labor Force | Age 30-34
In Labor Force | Age 30-34 Comparison
Immigrants from Panama
Austrians
84.3%
IN LABOR FORCE | AGE 30-34
6.3/ 100
METRIC RATING
218th/ 347
METRIC RANK
85.0%
IN LABOR FORCE | AGE 30-34
90.9/ 100
METRIC RATING
126th/ 347
METRIC RANK
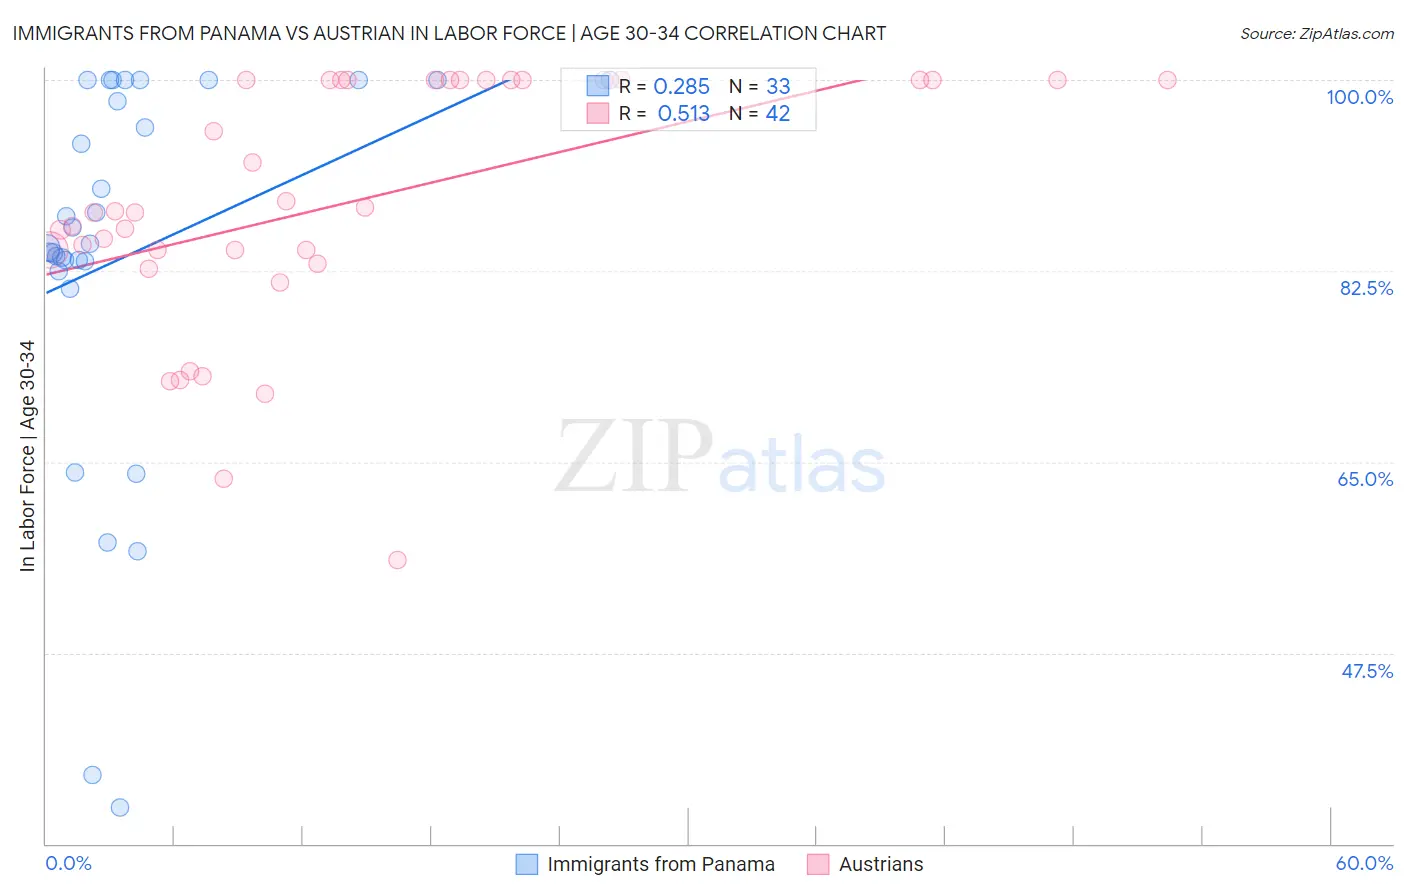
Immigrants from Panama vs Austrian In Labor Force | Age 30-34 Correlation Chart
The statistical analysis conducted on geographies consisting of 221,155,968 people shows a weak positive correlation between the proportion of Immigrants from Panama and labor force participation rate among population between the ages 30 and 34 in the United States with a correlation coefficient (R) of 0.285 and weighted average of 84.3%. Similarly, the statistical analysis conducted on geographies consisting of 451,661,783 people shows a substantial positive correlation between the proportion of Austrians and labor force participation rate among population between the ages 30 and 34 in the United States with a correlation coefficient (R) of 0.513 and weighted average of 85.0%, a difference of 0.88%.
In Labor Force | Age 30-34 Correlation Summary
| Measurement | Immigrants from Panama | Austrian |
| Minimum | 33.3% | 56.1% |
| Maximum | 100.0% | 100.0% |
| Range | 66.7% | 43.9% |
| Mean | 84.0% | 88.7% |
| Median | 85.0% | 87.9% |
| Interquartile 25% (IQ1) | 82.9% | 84.4% |
| Interquartile 75% (IQ3) | 100.0% | 100.0% |
| Interquartile Range (IQR) | 17.1% | 15.6% |
| Standard Deviation (Sample) | 17.6% | 11.4% |
| Standard Deviation (Population) | 17.3% | 11.3% |
Similar Demographics by In Labor Force | Age 30-34
Demographics Similar to Immigrants from Panama by In Labor Force | Age 30-34
In terms of in labor force | age 30-34, the demographic groups most similar to Immigrants from Panama are Immigrants from Ecuador (84.3%, a difference of 0.020%), Immigrants from Trinidad and Tobago (84.3%, a difference of 0.020%), Swiss (84.3%, a difference of 0.020%), Immigrants from Germany (84.3%, a difference of 0.030%), and European (84.3%, a difference of 0.030%).
| Demographics | Rating | Rank | In Labor Force | Age 30-34 |
| Japanese | 8.8 /100 | #211 | Tragic 84.3% |
| Immigrants | Western Asia | 8.2 /100 | #212 | Tragic 84.3% |
| Immigrants | Jamaica | 7.9 /100 | #213 | Tragic 84.3% |
| Immigrants | Germany | 7.2 /100 | #214 | Tragic 84.3% |
| Europeans | 7.2 /100 | #215 | Tragic 84.3% |
| Immigrants | Ecuador | 7.1 /100 | #216 | Tragic 84.3% |
| Immigrants | Trinidad and Tobago | 7.0 /100 | #217 | Tragic 84.3% |
| Immigrants | Panama | 6.3 /100 | #218 | Tragic 84.3% |
| Swiss | 5.8 /100 | #219 | Tragic 84.3% |
| Danes | 5.3 /100 | #220 | Tragic 84.3% |
| Salvadorans | 3.8 /100 | #221 | Tragic 84.2% |
| Panamanians | 3.8 /100 | #222 | Tragic 84.2% |
| Immigrants | Laos | 3.6 /100 | #223 | Tragic 84.2% |
| Cubans | 3.4 /100 | #224 | Tragic 84.2% |
| Scottish | 3.1 /100 | #225 | Tragic 84.2% |
Demographics Similar to Austrians by In Labor Force | Age 30-34
In terms of in labor force | age 30-34, the demographic groups most similar to Austrians are Slavic (85.0%, a difference of 0.0%), Immigrants from Jordan (85.0%, a difference of 0.010%), Immigrants from Argentina (85.0%, a difference of 0.010%), Australian (85.0%, a difference of 0.020%), and Immigrants from Western Africa (85.0%, a difference of 0.020%).
| Demographics | Rating | Rank | In Labor Force | Age 30-34 |
| Asians | 93.4 /100 | #119 | Exceptional 85.1% |
| Immigrants | Southern Europe | 93.3 /100 | #120 | Exceptional 85.1% |
| Immigrants | Egypt | 93.2 /100 | #121 | Exceptional 85.1% |
| Immigrants | Kuwait | 92.6 /100 | #122 | Exceptional 85.1% |
| Armenians | 92.2 /100 | #123 | Exceptional 85.0% |
| Australians | 92.0 /100 | #124 | Exceptional 85.0% |
| Immigrants | Jordan | 91.5 /100 | #125 | Exceptional 85.0% |
| Austrians | 90.9 /100 | #126 | Exceptional 85.0% |
| Slavs | 90.7 /100 | #127 | Exceptional 85.0% |
| Immigrants | Argentina | 90.6 /100 | #128 | Exceptional 85.0% |
| Immigrants | Western Africa | 90.2 /100 | #129 | Exceptional 85.0% |
| Immigrants | Spain | 90.0 /100 | #130 | Exceptional 85.0% |
| Chinese | 89.6 /100 | #131 | Excellent 85.0% |
| Immigrants | Israel | 89.5 /100 | #132 | Excellent 85.0% |
| New Zealanders | 89.5 /100 | #133 | Excellent 85.0% |