Immigrants from Panama vs Immigrants from Haiti In Labor Force | Age 30-34
COMPARE
Immigrants from Panama
Immigrants from Haiti
In Labor Force | Age 30-34
In Labor Force | Age 30-34 Comparison
Immigrants from Panama
Immigrants from Haiti
84.3%
IN LABOR FORCE | AGE 30-34
6.3/ 100
METRIC RATING
218th/ 347
METRIC RANK
84.2%
IN LABOR FORCE | AGE 30-34
2.8/ 100
METRIC RATING
228th/ 347
METRIC RANK
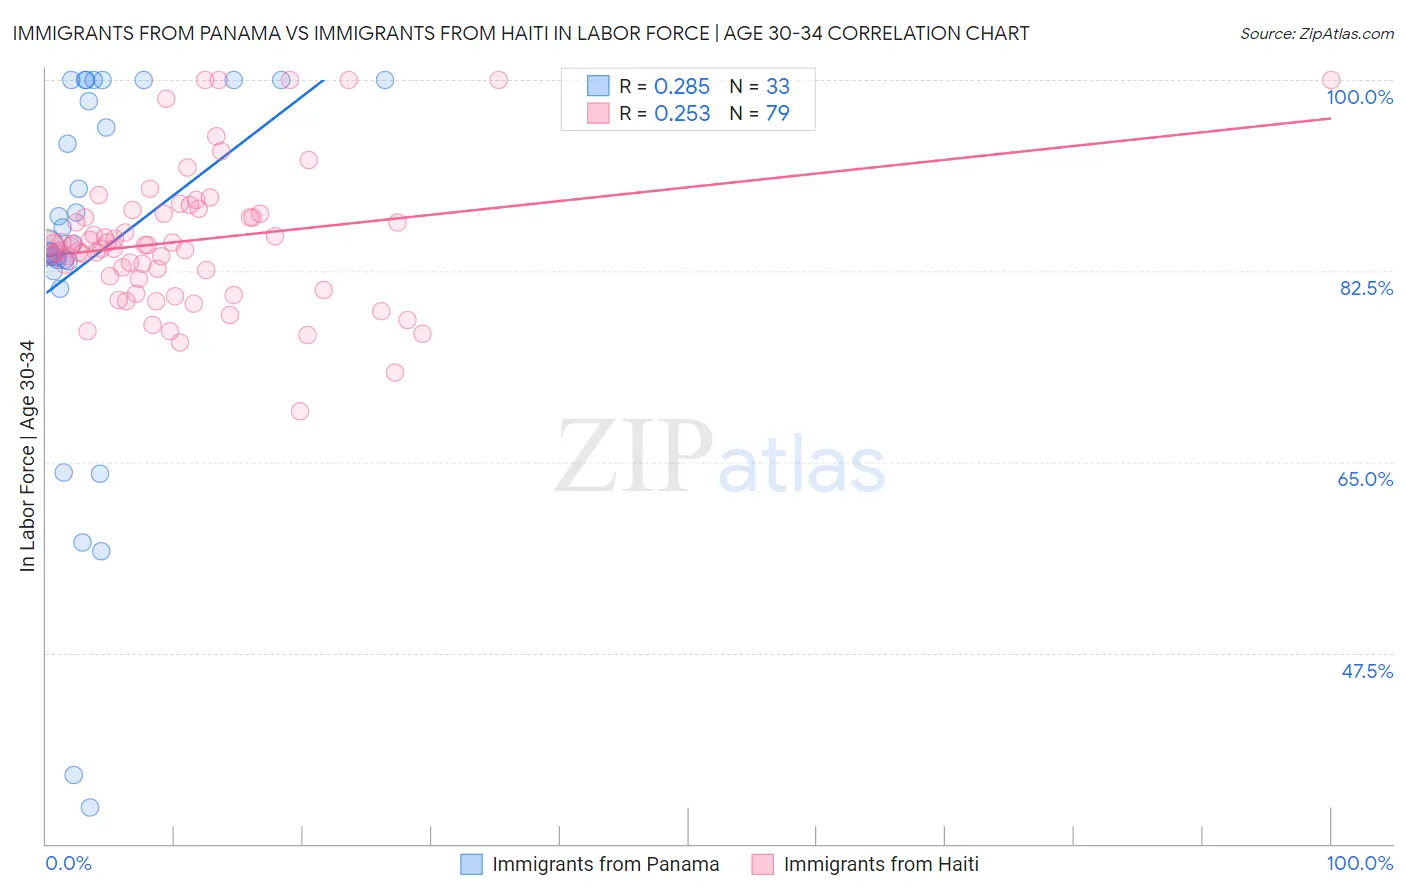
Immigrants from Panama vs Immigrants from Haiti In Labor Force | Age 30-34 Correlation Chart
The statistical analysis conducted on geographies consisting of 221,155,968 people shows a weak positive correlation between the proportion of Immigrants from Panama and labor force participation rate among population between the ages 30 and 34 in the United States with a correlation coefficient (R) of 0.285 and weighted average of 84.3%. Similarly, the statistical analysis conducted on geographies consisting of 225,211,020 people shows a weak positive correlation between the proportion of Immigrants from Haiti and labor force participation rate among population between the ages 30 and 34 in the United States with a correlation coefficient (R) of 0.253 and weighted average of 84.2%, a difference of 0.15%.
In Labor Force | Age 30-34 Correlation Summary
| Measurement | Immigrants from Panama | Immigrants from Haiti |
| Minimum | 33.3% | 69.6% |
| Maximum | 100.0% | 100.0% |
| Range | 66.7% | 30.4% |
| Mean | 84.0% | 85.3% |
| Median | 85.0% | 84.8% |
| Interquartile 25% (IQ1) | 82.9% | 81.8% |
| Interquartile 75% (IQ3) | 100.0% | 87.8% |
| Interquartile Range (IQR) | 17.1% | 6.0% |
| Standard Deviation (Sample) | 17.6% | 6.3% |
| Standard Deviation (Population) | 17.3% | 6.3% |
Demographics Similar to Immigrants from Panama and Immigrants from Haiti by In Labor Force | Age 30-34
In terms of in labor force | age 30-34, the demographic groups most similar to Immigrants from Panama are Immigrants from Ecuador (84.3%, a difference of 0.020%), Immigrants from Trinidad and Tobago (84.3%, a difference of 0.020%), Swiss (84.3%, a difference of 0.020%), Immigrants from Germany (84.3%, a difference of 0.030%), and European (84.3%, a difference of 0.030%). Similarly, the demographic groups most similar to Immigrants from Haiti are Scottish (84.2%, a difference of 0.010%), Immigrants from El Salvador (84.2%, a difference of 0.010%), Immigrants from Cuba (84.2%, a difference of 0.010%), Welsh (84.2%, a difference of 0.010%), and Immigrants from Bahamas (84.1%, a difference of 0.020%).
| Demographics | Rating | Rank | In Labor Force | Age 30-34 |
| Immigrants | Jamaica | 7.9 /100 | #213 | Tragic 84.3% |
| Immigrants | Germany | 7.2 /100 | #214 | Tragic 84.3% |
| Europeans | 7.2 /100 | #215 | Tragic 84.3% |
| Immigrants | Ecuador | 7.1 /100 | #216 | Tragic 84.3% |
| Immigrants | Trinidad and Tobago | 7.0 /100 | #217 | Tragic 84.3% |
| Immigrants | Panama | 6.3 /100 | #218 | Tragic 84.3% |
| Swiss | 5.8 /100 | #219 | Tragic 84.3% |
| Danes | 5.3 /100 | #220 | Tragic 84.3% |
| Salvadorans | 3.8 /100 | #221 | Tragic 84.2% |
| Panamanians | 3.8 /100 | #222 | Tragic 84.2% |
| Immigrants | Laos | 3.6 /100 | #223 | Tragic 84.2% |
| Cubans | 3.4 /100 | #224 | Tragic 84.2% |
| Scottish | 3.1 /100 | #225 | Tragic 84.2% |
| Immigrants | El Salvador | 3.0 /100 | #226 | Tragic 84.2% |
| Immigrants | Cuba | 3.0 /100 | #227 | Tragic 84.2% |
| Immigrants | Haiti | 2.8 /100 | #228 | Tragic 84.2% |
| Welsh | 2.7 /100 | #229 | Tragic 84.2% |
| Immigrants | Bahamas | 2.6 /100 | #230 | Tragic 84.1% |
| Malaysians | 2.2 /100 | #231 | Tragic 84.1% |
| Immigrants | Immigrants | 2.0 /100 | #232 | Tragic 84.1% |
| West Indians | 1.9 /100 | #233 | Tragic 84.1% |