Immigrants from Bolivia vs Bermudan In Labor Force | Age 45-54
COMPARE
Immigrants from Bolivia
Bermudan
In Labor Force | Age 45-54
In Labor Force | Age 45-54 Comparison
Immigrants from Bolivia
Bermudans
85.3%
IN LABOR FORCE | AGE 45-54
100.0/ 100
METRIC RATING
1st/ 347
METRIC RANK
83.1%
IN LABOR FORCE | AGE 45-54
88.0/ 100
METRIC RATING
124th/ 347
METRIC RANK
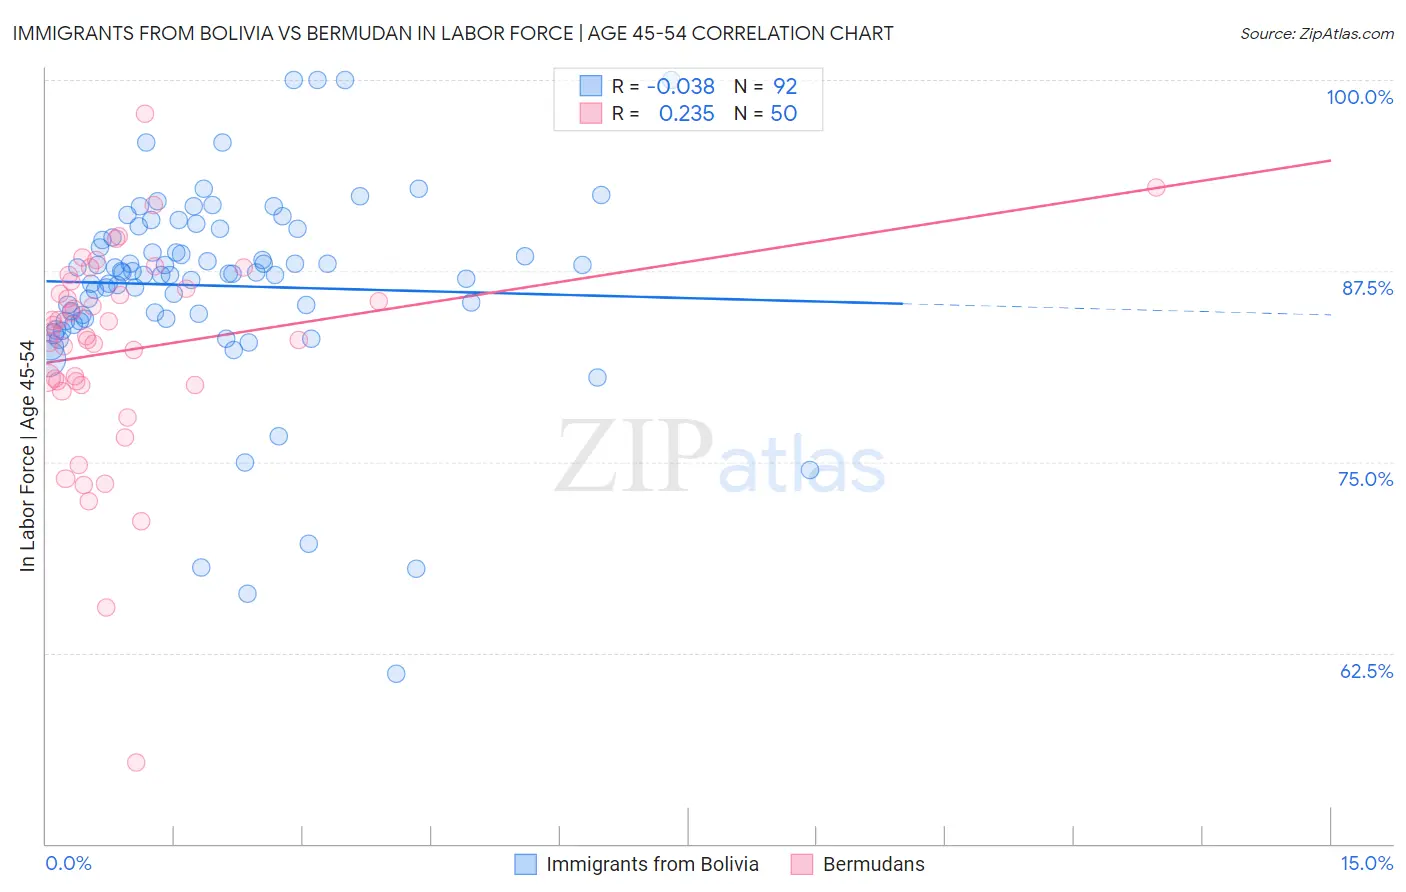
Immigrants from Bolivia vs Bermudan In Labor Force | Age 45-54 Correlation Chart
The statistical analysis conducted on geographies consisting of 158,712,400 people shows no correlation between the proportion of Immigrants from Bolivia and labor force participation rate among population between the ages 45 and 54 in the United States with a correlation coefficient (R) of -0.038 and weighted average of 85.3%. Similarly, the statistical analysis conducted on geographies consisting of 55,715,223 people shows a weak positive correlation between the proportion of Bermudans and labor force participation rate among population between the ages 45 and 54 in the United States with a correlation coefficient (R) of 0.235 and weighted average of 83.1%, a difference of 2.6%.
In Labor Force | Age 45-54 Correlation Summary
| Measurement | Immigrants from Bolivia | Bermudan |
| Minimum | 61.1% | 55.3% |
| Maximum | 100.0% | 97.8% |
| Range | 38.9% | 42.5% |
| Mean | 86.5% | 82.3% |
| Median | 87.3% | 83.3% |
| Interquartile 25% (IQ1) | 84.4% | 80.0% |
| Interquartile 75% (IQ3) | 90.0% | 86.3% |
| Interquartile Range (IQR) | 5.6% | 6.3% |
| Standard Deviation (Sample) | 6.6% | 7.1% |
| Standard Deviation (Population) | 6.6% | 7.0% |
Similar Demographics by In Labor Force | Age 45-54
Demographics Similar to Immigrants from Bolivia by In Labor Force | Age 45-54
In terms of in labor force | age 45-54, the demographic groups most similar to Immigrants from Bolivia are Luxembourger (85.0%, a difference of 0.34%), Bolivian (84.9%, a difference of 0.43%), Immigrants from Ethiopia (84.8%, a difference of 0.55%), Ethiopian (84.8%, a difference of 0.63%), and Immigrants from India (84.7%, a difference of 0.74%).
| Demographics | Rating | Rank | In Labor Force | Age 45-54 |
| Immigrants | Bolivia | 100.0 /100 | #1 | Exceptional 85.3% |
| Luxembourgers | 100.0 /100 | #2 | Exceptional 85.0% |
| Bolivians | 100.0 /100 | #3 | Exceptional 84.9% |
| Immigrants | Ethiopia | 100.0 /100 | #4 | Exceptional 84.8% |
| Ethiopians | 100.0 /100 | #5 | Exceptional 84.8% |
| Immigrants | India | 100.0 /100 | #6 | Exceptional 84.7% |
| Immigrants | Cameroon | 100.0 /100 | #7 | Exceptional 84.6% |
| Sierra Leoneans | 100.0 /100 | #8 | Exceptional 84.5% |
| Immigrants | Sierra Leone | 100.0 /100 | #9 | Exceptional 84.4% |
| Norwegians | 100.0 /100 | #10 | Exceptional 84.4% |
| Thais | 100.0 /100 | #11 | Exceptional 84.3% |
| Bulgarians | 100.0 /100 | #12 | Exceptional 84.2% |
| Chinese | 99.9 /100 | #13 | Exceptional 84.1% |
| Cambodians | 99.9 /100 | #14 | Exceptional 84.1% |
| Cypriots | 99.9 /100 | #15 | Exceptional 84.1% |
Demographics Similar to Bermudans by In Labor Force | Age 45-54
In terms of in labor force | age 45-54, the demographic groups most similar to Bermudans are Tongan (83.1%, a difference of 0.0%), Immigrants from Vietnam (83.1%, a difference of 0.020%), Immigrants from Iran (83.1%, a difference of 0.020%), Uruguayan (83.1%, a difference of 0.030%), and Immigrants from Belgium (83.1%, a difference of 0.030%).
| Demographics | Rating | Rank | In Labor Force | Age 45-54 |
| Immigrants | China | 90.9 /100 | #117 | Exceptional 83.2% |
| Immigrants | Europe | 90.7 /100 | #118 | Exceptional 83.2% |
| Immigrants | Uruguay | 90.2 /100 | #119 | Exceptional 83.2% |
| Immigrants | Russia | 90.1 /100 | #120 | Exceptional 83.2% |
| Uruguayans | 89.4 /100 | #121 | Excellent 83.1% |
| Immigrants | Vietnam | 88.9 /100 | #122 | Excellent 83.1% |
| Tongans | 88.2 /100 | #123 | Excellent 83.1% |
| Bermudans | 88.0 /100 | #124 | Excellent 83.1% |
| Immigrants | Iran | 87.2 /100 | #125 | Excellent 83.1% |
| Immigrants | Belgium | 86.4 /100 | #126 | Excellent 83.1% |
| Immigrants | Jordan | 85.2 /100 | #127 | Excellent 83.1% |
| Germans | 85.1 /100 | #128 | Excellent 83.1% |
| Immigrants | Northern Europe | 85.1 /100 | #129 | Excellent 83.1% |
| Immigrants | Israel | 84.7 /100 | #130 | Excellent 83.1% |
| Finns | 83.3 /100 | #131 | Excellent 83.1% |