Immigrants from Oceania vs Immigrants from Western Africa In Labor Force | Age 16-19
COMPARE
Immigrants from Oceania
Immigrants from Western Africa
In Labor Force | Age 16-19
In Labor Force | Age 16-19 Comparison
Immigrants from Oceania
Immigrants from Western Africa
37.9%
IN LABOR FORCE | AGE 16-19
94.7/ 100
METRIC RATING
132nd/ 347
METRIC RANK
36.9%
IN LABOR FORCE | AGE 16-19
66.7/ 100
METRIC RATING
166th/ 347
METRIC RANK
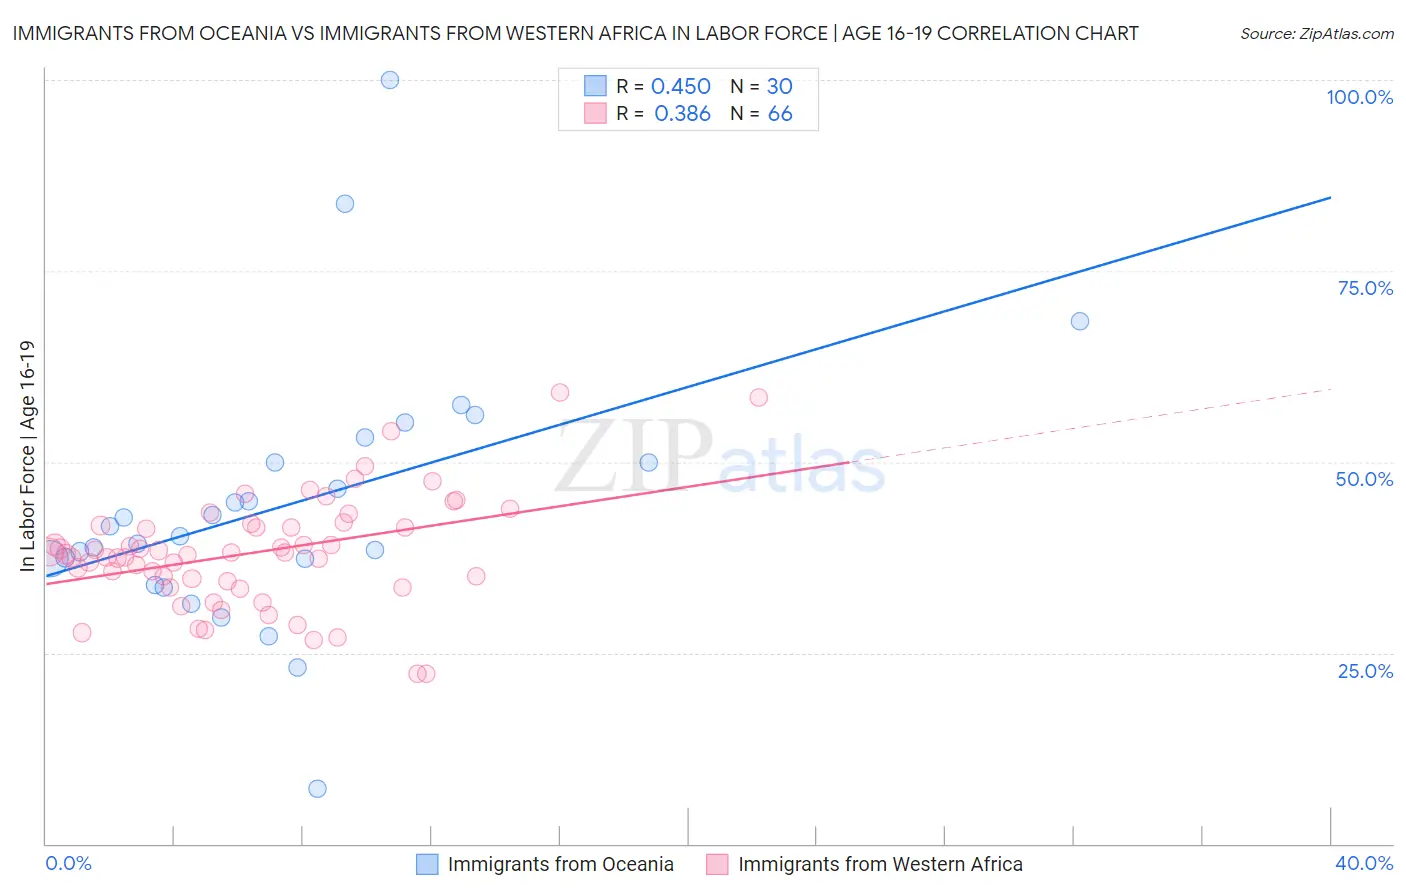
Immigrants from Oceania vs Immigrants from Western Africa In Labor Force | Age 16-19 Correlation Chart
The statistical analysis conducted on geographies consisting of 305,018,730 people shows a moderate positive correlation between the proportion of Immigrants from Oceania and labor force participation rate among population between the ages 16 and 19 in the United States with a correlation coefficient (R) of 0.450 and weighted average of 37.9%. Similarly, the statistical analysis conducted on geographies consisting of 357,569,133 people shows a mild positive correlation between the proportion of Immigrants from Western Africa and labor force participation rate among population between the ages 16 and 19 in the United States with a correlation coefficient (R) of 0.386 and weighted average of 36.9%, a difference of 2.7%.
In Labor Force | Age 16-19 Correlation Summary
| Measurement | Immigrants from Oceania | Immigrants from Western Africa |
| Minimum | 7.3% | 22.2% |
| Maximum | 100.0% | 59.1% |
| Range | 92.7% | 36.9% |
| Mean | 44.3% | 38.1% |
| Median | 40.9% | 38.0% |
| Interquartile 25% (IQ1) | 37.3% | 34.4% |
| Interquartile 75% (IQ3) | 50.0% | 41.7% |
| Interquartile Range (IQR) | 12.7% | 7.3% |
| Standard Deviation (Sample) | 17.5% | 7.3% |
| Standard Deviation (Population) | 17.2% | 7.2% |
Similar Demographics by In Labor Force | Age 16-19
Demographics Similar to Immigrants from Oceania by In Labor Force | Age 16-19
In terms of in labor force | age 16-19, the demographic groups most similar to Immigrants from Oceania are Cheyenne (37.9%, a difference of 0.020%), Immigrants from Austria (37.9%, a difference of 0.080%), Immigrants from Zimbabwe (38.0%, a difference of 0.18%), Spaniard (38.0%, a difference of 0.21%), and Choctaw (38.0%, a difference of 0.23%).
| Demographics | Rating | Rank | In Labor Force | Age 16-19 |
| Immigrants | Africa | 96.1 /100 | #125 | Exceptional 38.0% |
| Africans | 95.6 /100 | #126 | Exceptional 38.0% |
| Choctaw | 95.6 /100 | #127 | Exceptional 38.0% |
| New Zealanders | 95.6 /100 | #128 | Exceptional 38.0% |
| Spaniards | 95.5 /100 | #129 | Exceptional 38.0% |
| Immigrants | Zimbabwe | 95.4 /100 | #130 | Exceptional 38.0% |
| Immigrants | Austria | 95.0 /100 | #131 | Exceptional 37.9% |
| Immigrants | Oceania | 94.7 /100 | #132 | Exceptional 37.9% |
| Cheyenne | 94.6 /100 | #133 | Exceptional 37.9% |
| Immigrants | Netherlands | 93.7 /100 | #134 | Exceptional 37.8% |
| Macedonians | 93.4 /100 | #135 | Exceptional 37.8% |
| Australians | 93.2 /100 | #136 | Exceptional 37.8% |
| Cajuns | 93.2 /100 | #137 | Exceptional 37.8% |
| Comanche | 91.9 /100 | #138 | Exceptional 37.7% |
| Immigrants | Moldova | 91.9 /100 | #139 | Exceptional 37.7% |
Demographics Similar to Immigrants from Western Africa by In Labor Force | Age 16-19
In terms of in labor force | age 16-19, the demographic groups most similar to Immigrants from Western Africa are Yakama (36.9%, a difference of 0.010%), Immigrants from Kuwait (36.9%, a difference of 0.12%), Bermudan (36.9%, a difference of 0.15%), Immigrants from Jordan (36.9%, a difference of 0.16%), and Arab (36.8%, a difference of 0.17%).
| Demographics | Rating | Rank | In Labor Force | Age 16-19 |
| Yaqui | 74.4 /100 | #159 | Good 37.1% |
| Immigrants | Saudi Arabia | 73.9 /100 | #160 | Good 37.0% |
| Cambodians | 71.5 /100 | #161 | Good 37.0% |
| Immigrants | Jordan | 69.5 /100 | #162 | Good 36.9% |
| Bermudans | 69.3 /100 | #163 | Good 36.9% |
| Immigrants | Kuwait | 68.9 /100 | #164 | Good 36.9% |
| Yakama | 66.9 /100 | #165 | Good 36.9% |
| Immigrants | Western Africa | 66.7 /100 | #166 | Good 36.9% |
| Arabs | 63.6 /100 | #167 | Good 36.8% |
| Palestinians | 63.1 /100 | #168 | Good 36.8% |
| Immigrants | Latvia | 61.6 /100 | #169 | Good 36.8% |
| Immigrants | South Africa | 60.5 /100 | #170 | Good 36.8% |
| Immigrants | Cambodia | 58.4 /100 | #171 | Average 36.7% |
| South Africans | 58.3 /100 | #172 | Average 36.7% |
| Russians | 57.5 /100 | #173 | Average 36.7% |