Immigrants from Oceania vs Immigrants from Uzbekistan In Labor Force | Age 16-19
COMPARE
Immigrants from Oceania
Immigrants from Uzbekistan
In Labor Force | Age 16-19
In Labor Force | Age 16-19 Comparison
Immigrants from Oceania
Immigrants from Uzbekistan
37.9%
IN LABOR FORCE | AGE 16-19
94.7/ 100
METRIC RATING
132nd/ 347
METRIC RANK
29.2%
IN LABOR FORCE | AGE 16-19
0.0/ 100
METRIC RATING
339th/ 347
METRIC RANK
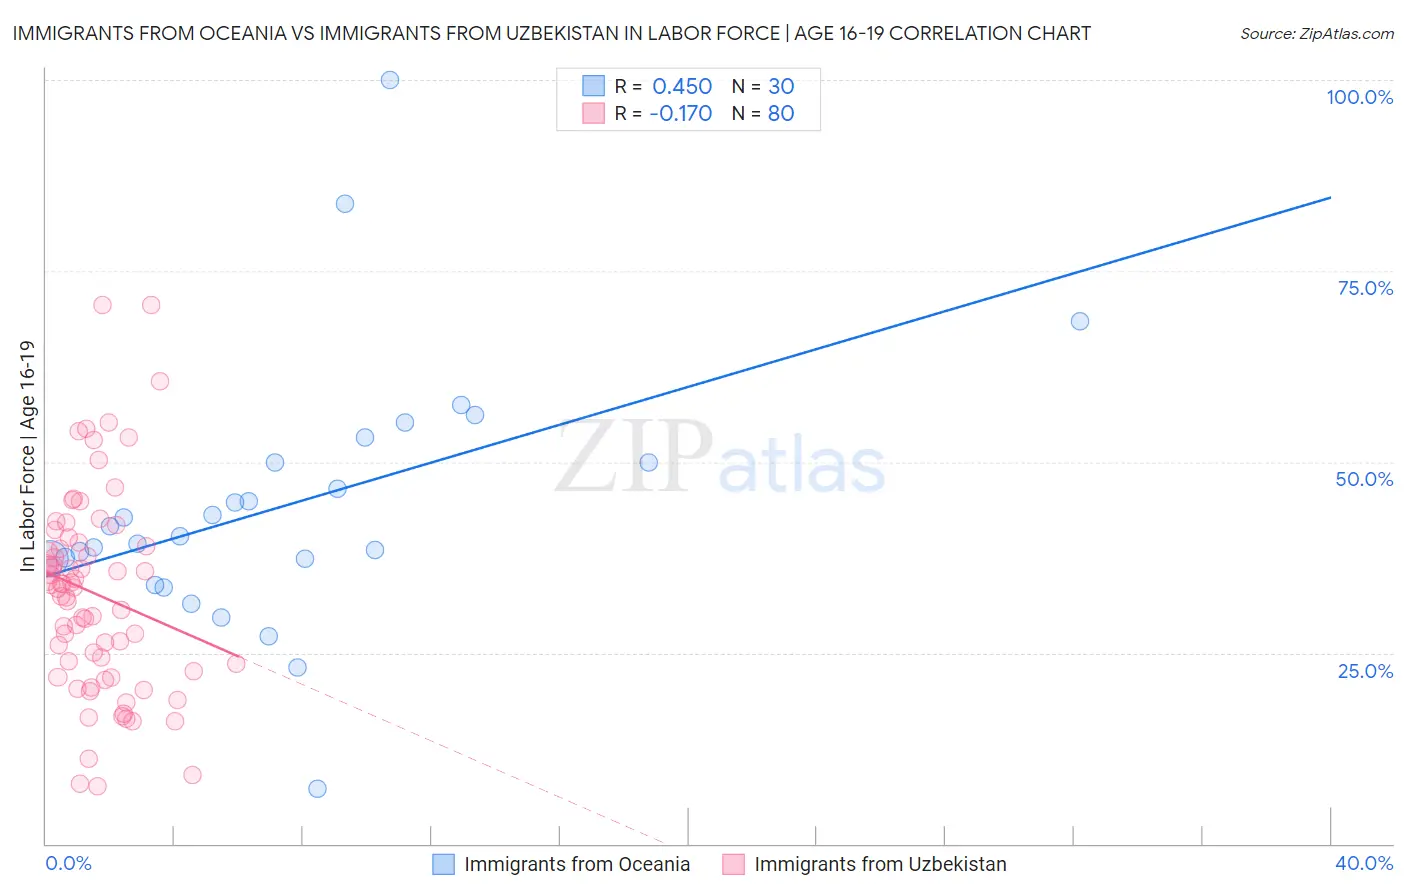
Immigrants from Oceania vs Immigrants from Uzbekistan In Labor Force | Age 16-19 Correlation Chart
The statistical analysis conducted on geographies consisting of 305,018,730 people shows a moderate positive correlation between the proportion of Immigrants from Oceania and labor force participation rate among population between the ages 16 and 19 in the United States with a correlation coefficient (R) of 0.450 and weighted average of 37.9%. Similarly, the statistical analysis conducted on geographies consisting of 118,707,763 people shows a poor negative correlation between the proportion of Immigrants from Uzbekistan and labor force participation rate among population between the ages 16 and 19 in the United States with a correlation coefficient (R) of -0.170 and weighted average of 29.2%, a difference of 30.0%.
In Labor Force | Age 16-19 Correlation Summary
| Measurement | Immigrants from Oceania | Immigrants from Uzbekistan |
| Minimum | 7.3% | 7.6% |
| Maximum | 100.0% | 70.6% |
| Range | 92.7% | 63.0% |
| Mean | 44.3% | 32.8% |
| Median | 40.9% | 33.7% |
| Interquartile 25% (IQ1) | 37.3% | 23.1% |
| Interquartile 75% (IQ3) | 50.0% | 39.2% |
| Interquartile Range (IQR) | 12.7% | 16.1% |
| Standard Deviation (Sample) | 17.5% | 13.1% |
| Standard Deviation (Population) | 17.2% | 13.0% |
Similar Demographics by In Labor Force | Age 16-19
Demographics Similar to Immigrants from Oceania by In Labor Force | Age 16-19
In terms of in labor force | age 16-19, the demographic groups most similar to Immigrants from Oceania are Cheyenne (37.9%, a difference of 0.020%), Immigrants from Austria (37.9%, a difference of 0.080%), Immigrants from Zimbabwe (38.0%, a difference of 0.18%), Spaniard (38.0%, a difference of 0.21%), and Choctaw (38.0%, a difference of 0.23%).
| Demographics | Rating | Rank | In Labor Force | Age 16-19 |
| Immigrants | Africa | 96.1 /100 | #125 | Exceptional 38.0% |
| Africans | 95.6 /100 | #126 | Exceptional 38.0% |
| Choctaw | 95.6 /100 | #127 | Exceptional 38.0% |
| New Zealanders | 95.6 /100 | #128 | Exceptional 38.0% |
| Spaniards | 95.5 /100 | #129 | Exceptional 38.0% |
| Immigrants | Zimbabwe | 95.4 /100 | #130 | Exceptional 38.0% |
| Immigrants | Austria | 95.0 /100 | #131 | Exceptional 37.9% |
| Immigrants | Oceania | 94.7 /100 | #132 | Exceptional 37.9% |
| Cheyenne | 94.6 /100 | #133 | Exceptional 37.9% |
| Immigrants | Netherlands | 93.7 /100 | #134 | Exceptional 37.8% |
| Macedonians | 93.4 /100 | #135 | Exceptional 37.8% |
| Australians | 93.2 /100 | #136 | Exceptional 37.8% |
| Cajuns | 93.2 /100 | #137 | Exceptional 37.8% |
| Comanche | 91.9 /100 | #138 | Exceptional 37.7% |
| Immigrants | Moldova | 91.9 /100 | #139 | Exceptional 37.7% |
Demographics Similar to Immigrants from Uzbekistan by In Labor Force | Age 16-19
In terms of in labor force | age 16-19, the demographic groups most similar to Immigrants from Uzbekistan are British West Indian (29.1%, a difference of 0.20%), Immigrants from Armenia (29.0%, a difference of 0.43%), Immigrants from Barbados (29.0%, a difference of 0.58%), Vietnamese (29.6%, a difference of 1.4%), and Immigrants from Bangladesh (30.0%, a difference of 3.1%).
| Demographics | Rating | Rank | In Labor Force | Age 16-19 |
| Immigrants | Israel | 0.0 /100 | #332 | Tragic 30.5% |
| Immigrants | Hong Kong | 0.0 /100 | #333 | Tragic 30.5% |
| Puerto Ricans | 0.0 /100 | #334 | Tragic 30.3% |
| Immigrants | Cuba | 0.0 /100 | #335 | Tragic 30.2% |
| Immigrants | Trinidad and Tobago | 0.0 /100 | #336 | Tragic 30.2% |
| Immigrants | Bangladesh | 0.0 /100 | #337 | Tragic 30.0% |
| Vietnamese | 0.0 /100 | #338 | Tragic 29.6% |
| Immigrants | Uzbekistan | 0.0 /100 | #339 | Tragic 29.2% |
| British West Indians | 0.0 /100 | #340 | Tragic 29.1% |
| Immigrants | Armenia | 0.0 /100 | #341 | Tragic 29.0% |
| Immigrants | Barbados | 0.0 /100 | #342 | Tragic 29.0% |
| Yuman | 0.0 /100 | #343 | Tragic 27.7% |
| Guyanese | 0.0 /100 | #344 | Tragic 27.4% |
| Immigrants | Guyana | 0.0 /100 | #345 | Tragic 27.3% |
| Immigrants | St. Vincent and the Grenadines | 0.0 /100 | #346 | Tragic 26.3% |