Immigrants from Oceania vs Immigrants from South America In Labor Force | Age 25-29
COMPARE
Immigrants from Oceania
Immigrants from South America
In Labor Force | Age 25-29
In Labor Force | Age 25-29 Comparison
Immigrants from Oceania
Immigrants from South America
84.2%
IN LABOR FORCE | AGE 25-29
5.0/ 100
METRIC RATING
229th/ 347
METRIC RANK
84.6%
IN LABOR FORCE | AGE 25-29
42.9/ 100
METRIC RATING
180th/ 347
METRIC RANK
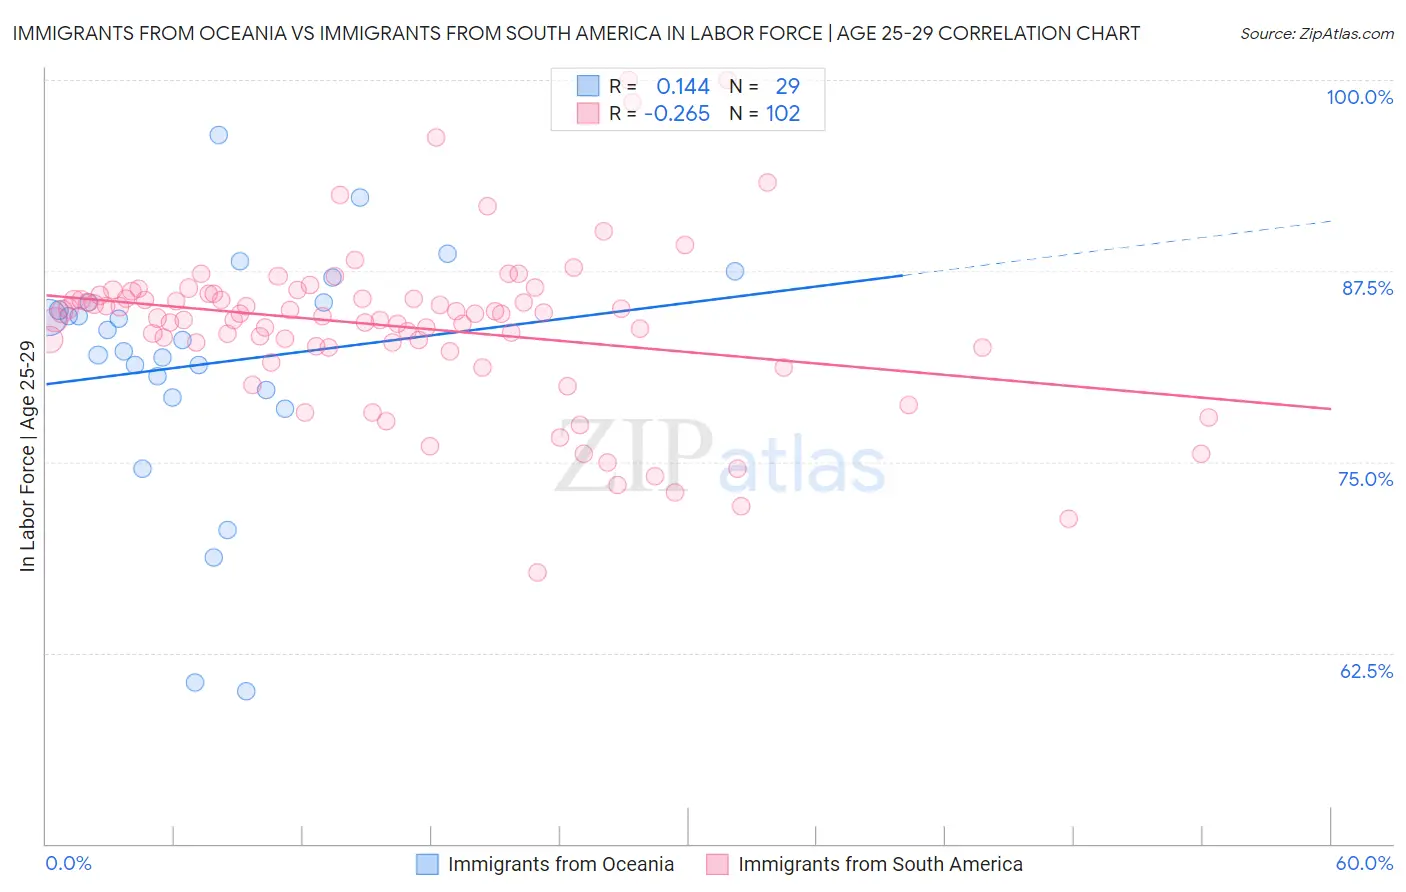
Immigrants from Oceania vs Immigrants from South America In Labor Force | Age 25-29 Correlation Chart
The statistical analysis conducted on geographies consisting of 305,432,144 people shows a poor positive correlation between the proportion of Immigrants from Oceania and labor force participation rate among population between the ages 25 and 29 in the United States with a correlation coefficient (R) of 0.144 and weighted average of 84.2%. Similarly, the statistical analysis conducted on geographies consisting of 486,086,715 people shows a weak negative correlation between the proportion of Immigrants from South America and labor force participation rate among population between the ages 25 and 29 in the United States with a correlation coefficient (R) of -0.265 and weighted average of 84.6%, a difference of 0.49%.
In Labor Force | Age 25-29 Correlation Summary
| Measurement | Immigrants from Oceania | Immigrants from South America |
| Minimum | 60.0% | 67.7% |
| Maximum | 96.4% | 100.0% |
| Range | 36.4% | 32.3% |
| Mean | 81.4% | 83.8% |
| Median | 83.0% | 84.6% |
| Interquartile 25% (IQ1) | 79.5% | 82.5% |
| Interquartile 75% (IQ3) | 85.4% | 85.9% |
| Interquartile Range (IQR) | 6.0% | 3.4% |
| Standard Deviation (Sample) | 8.1% | 5.4% |
| Standard Deviation (Population) | 8.0% | 5.4% |
Similar Demographics by In Labor Force | Age 25-29
Demographics Similar to Immigrants from Oceania by In Labor Force | Age 25-29
In terms of in labor force | age 25-29, the demographic groups most similar to Immigrants from Oceania are White/Caucasian (84.2%, a difference of 0.0%), Immigrants from Philippines (84.2%, a difference of 0.010%), French American Indian (84.2%, a difference of 0.020%), Immigrants from Panama (84.2%, a difference of 0.020%), and Panamanian (84.2%, a difference of 0.020%).
| Demographics | Rating | Rank | In Labor Force | Age 25-29 |
| Jordanians | 6.7 /100 | #222 | Tragic 84.2% |
| Scotch-Irish | 6.5 /100 | #223 | Tragic 84.2% |
| Immigrants | West Indies | 6.0 /100 | #224 | Tragic 84.2% |
| Koreans | 5.9 /100 | #225 | Tragic 84.2% |
| Immigrants | Congo | 5.8 /100 | #226 | Tragic 84.2% |
| French American Indians | 5.5 /100 | #227 | Tragic 84.2% |
| Immigrants | Panama | 5.5 /100 | #228 | Tragic 84.2% |
| Immigrants | Oceania | 5.0 /100 | #229 | Tragic 84.2% |
| Whites/Caucasians | 4.8 /100 | #230 | Tragic 84.2% |
| Immigrants | Philippines | 4.7 /100 | #231 | Tragic 84.2% |
| Panamanians | 4.5 /100 | #232 | Tragic 84.2% |
| Immigrants | Western Asia | 2.7 /100 | #233 | Tragic 84.1% |
| Barbadians | 1.0 /100 | #234 | Tragic 83.9% |
| Iraqis | 0.9 /100 | #235 | Tragic 83.9% |
| Guamanians/Chamorros | 0.9 /100 | #236 | Tragic 83.9% |
Demographics Similar to Immigrants from South America by In Labor Force | Age 25-29
In terms of in labor force | age 25-29, the demographic groups most similar to Immigrants from South America are Immigrants from Argentina (84.6%, a difference of 0.010%), Immigrants from Norway (84.6%, a difference of 0.010%), Immigrants from China (84.6%, a difference of 0.020%), Immigrants from Thailand (84.6%, a difference of 0.020%), and European (84.6%, a difference of 0.020%).
| Demographics | Rating | Rank | In Labor Force | Age 25-29 |
| Assyrians/Chaldeans/Syriacs | 50.2 /100 | #173 | Average 84.7% |
| Palestinians | 50.0 /100 | #174 | Average 84.7% |
| Hungarians | 47.8 /100 | #175 | Average 84.6% |
| Malaysians | 46.8 /100 | #176 | Average 84.6% |
| Immigrants | China | 45.7 /100 | #177 | Average 84.6% |
| Immigrants | Thailand | 45.2 /100 | #178 | Average 84.6% |
| Immigrants | Argentina | 44.0 /100 | #179 | Average 84.6% |
| Immigrants | South America | 42.9 /100 | #180 | Average 84.6% |
| Immigrants | Norway | 41.9 /100 | #181 | Average 84.6% |
| Europeans | 40.3 /100 | #182 | Average 84.6% |
| Scottish | 40.1 /100 | #183 | Average 84.6% |
| Immigrants | Kuwait | 38.2 /100 | #184 | Fair 84.6% |
| Immigrants | Denmark | 37.0 /100 | #185 | Fair 84.6% |
| Immigrants | Belgium | 35.0 /100 | #186 | Fair 84.6% |
| Immigrants | Portugal | 34.7 /100 | #187 | Fair 84.6% |