Immigrants from Colombia vs Hopi In Labor Force | Age 30-34
COMPARE
Immigrants from Colombia
Hopi
In Labor Force | Age 30-34
In Labor Force | Age 30-34 Comparison
Immigrants from Colombia
Hopi
84.9%
IN LABOR FORCE | AGE 30-34
76.3/ 100
METRIC RATING
147th/ 347
METRIC RANK
79.3%
IN LABOR FORCE | AGE 30-34
0.0/ 100
METRIC RATING
334th/ 347
METRIC RANK
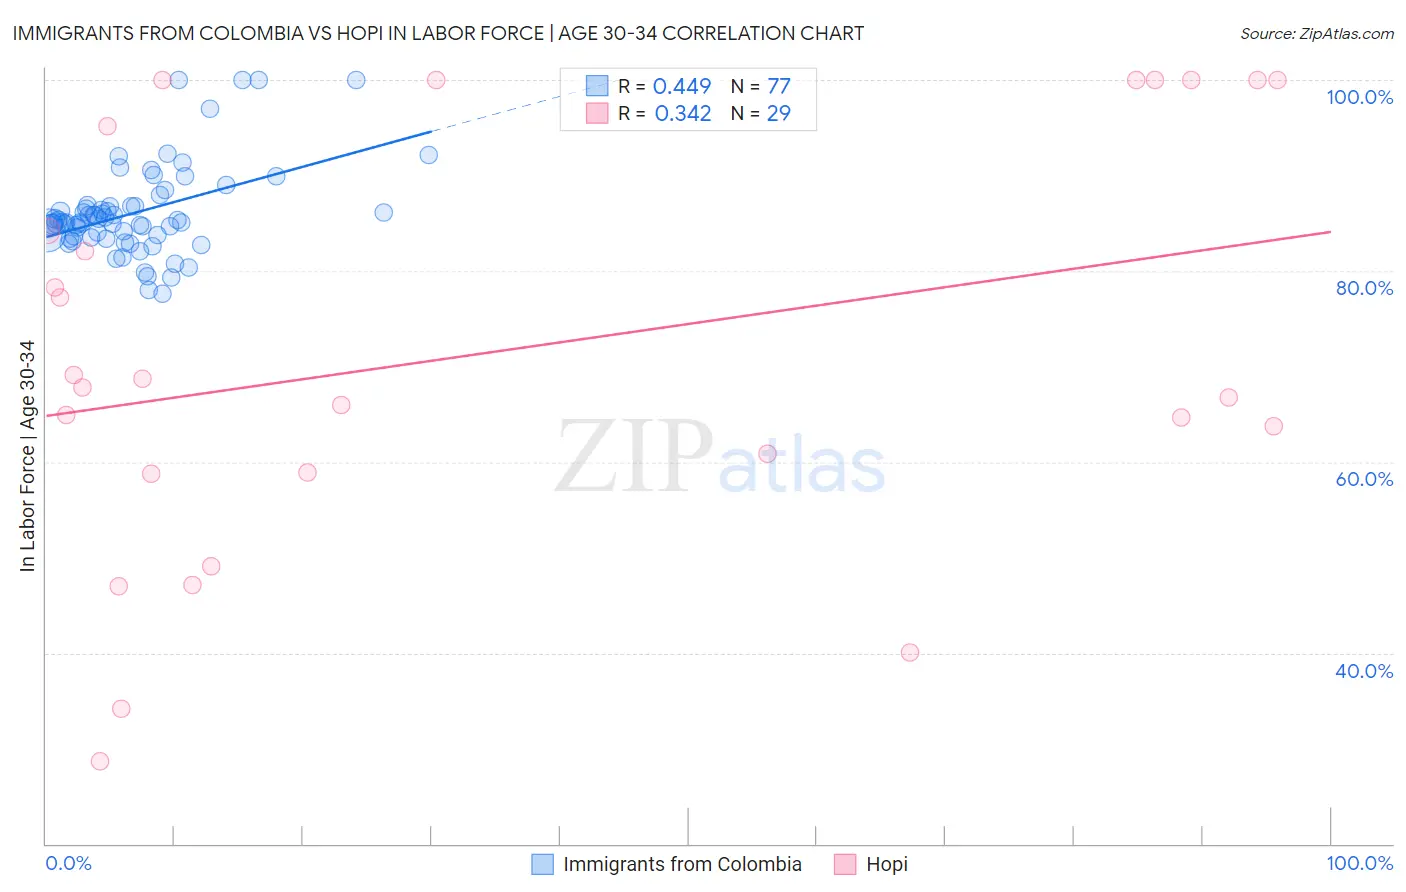
Immigrants from Colombia vs Hopi In Labor Force | Age 30-34 Correlation Chart
The statistical analysis conducted on geographies consisting of 378,496,738 people shows a moderate positive correlation between the proportion of Immigrants from Colombia and labor force participation rate among population between the ages 30 and 34 in the United States with a correlation coefficient (R) of 0.449 and weighted average of 84.9%. Similarly, the statistical analysis conducted on geographies consisting of 74,731,865 people shows a mild positive correlation between the proportion of Hopi and labor force participation rate among population between the ages 30 and 34 in the United States with a correlation coefficient (R) of 0.342 and weighted average of 79.3%, a difference of 7.1%.
In Labor Force | Age 30-34 Correlation Summary
| Measurement | Immigrants from Colombia | Hopi |
| Minimum | 77.6% | 28.6% |
| Maximum | 100.0% | 100.0% |
| Range | 22.4% | 71.4% |
| Mean | 86.1% | 71.5% |
| Median | 85.1% | 67.8% |
| Interquartile 25% (IQ1) | 83.6% | 58.9% |
| Interquartile 75% (IQ3) | 86.8% | 97.6% |
| Interquartile Range (IQR) | 3.2% | 38.7% |
| Standard Deviation (Sample) | 4.7% | 21.7% |
| Standard Deviation (Population) | 4.6% | 21.3% |
Similar Demographics by In Labor Force | Age 30-34
Demographics Similar to Immigrants from Colombia by In Labor Force | Age 30-34
In terms of in labor force | age 30-34, the demographic groups most similar to Immigrants from Colombia are Immigrants from Saudi Arabia (84.9%, a difference of 0.0%), Immigrants from Pakistan (84.9%, a difference of 0.0%), Palestinian (84.9%, a difference of 0.010%), Immigrants from Ukraine (84.8%, a difference of 0.010%), and German (84.8%, a difference of 0.010%).
| Demographics | Rating | Rank | In Labor Force | Age 30-34 |
| Immigrants | Vietnam | 86.5 /100 | #140 | Excellent 85.0% |
| Chileans | 85.3 /100 | #141 | Excellent 84.9% |
| Immigrants | Indonesia | 84.3 /100 | #142 | Excellent 84.9% |
| Colombians | 82.2 /100 | #143 | Excellent 84.9% |
| Uruguayans | 78.5 /100 | #144 | Good 84.9% |
| Palestinians | 77.7 /100 | #145 | Good 84.9% |
| Immigrants | Saudi Arabia | 76.6 /100 | #146 | Good 84.9% |
| Immigrants | Colombia | 76.3 /100 | #147 | Good 84.9% |
| Immigrants | Pakistan | 76.2 /100 | #148 | Good 84.9% |
| Immigrants | Ukraine | 75.1 /100 | #149 | Good 84.8% |
| Germans | 75.1 /100 | #150 | Good 84.8% |
| Immigrants | Senegal | 74.0 /100 | #151 | Good 84.8% |
| Romanians | 73.5 /100 | #152 | Good 84.8% |
| Syrians | 70.1 /100 | #153 | Good 84.8% |
| Northern Europeans | 70.0 /100 | #154 | Good 84.8% |
Demographics Similar to Hopi by In Labor Force | Age 30-34
In terms of in labor force | age 30-34, the demographic groups most similar to Hopi are Marshallese (79.2%, a difference of 0.030%), Native/Alaskan (79.2%, a difference of 0.12%), Yakama (79.1%, a difference of 0.15%), Pima (79.0%, a difference of 0.28%), and Apache (79.0%, a difference of 0.30%).
| Demographics | Rating | Rank | In Labor Force | Age 30-34 |
| Colville | 0.0 /100 | #327 | Tragic 80.7% |
| Sioux | 0.0 /100 | #328 | Tragic 80.4% |
| Creek | 0.0 /100 | #329 | Tragic 80.4% |
| Pueblo | 0.0 /100 | #330 | Tragic 80.0% |
| Houma | 0.0 /100 | #331 | Tragic 79.9% |
| Kiowa | 0.0 /100 | #332 | Tragic 79.8% |
| Inupiat | 0.0 /100 | #333 | Tragic 79.7% |
| Hopi | 0.0 /100 | #334 | Tragic 79.3% |
| Marshallese | 0.0 /100 | #335 | Tragic 79.2% |
| Natives/Alaskans | 0.0 /100 | #336 | Tragic 79.2% |
| Yakama | 0.0 /100 | #337 | Tragic 79.1% |
| Pima | 0.0 /100 | #338 | Tragic 79.0% |
| Apache | 0.0 /100 | #339 | Tragic 79.0% |
| Ute | 0.0 /100 | #340 | Tragic 78.9% |
| Immigrants | Yemen | 0.0 /100 | #341 | Tragic 78.2% |