Immigrants from Norway vs Yup'ik In Labor Force | Age 45-54
COMPARE
Immigrants from Norway
Yup'ik
In Labor Force | Age 45-54
In Labor Force | Age 45-54 Comparison
Immigrants from Norway
Yup'ik
82.5%
IN LABOR FORCE | AGE 45-54
20.7/ 100
METRIC RATING
194th/ 347
METRIC RANK
78.6%
IN LABOR FORCE | AGE 45-54
0.0/ 100
METRIC RATING
321st/ 347
METRIC RANK
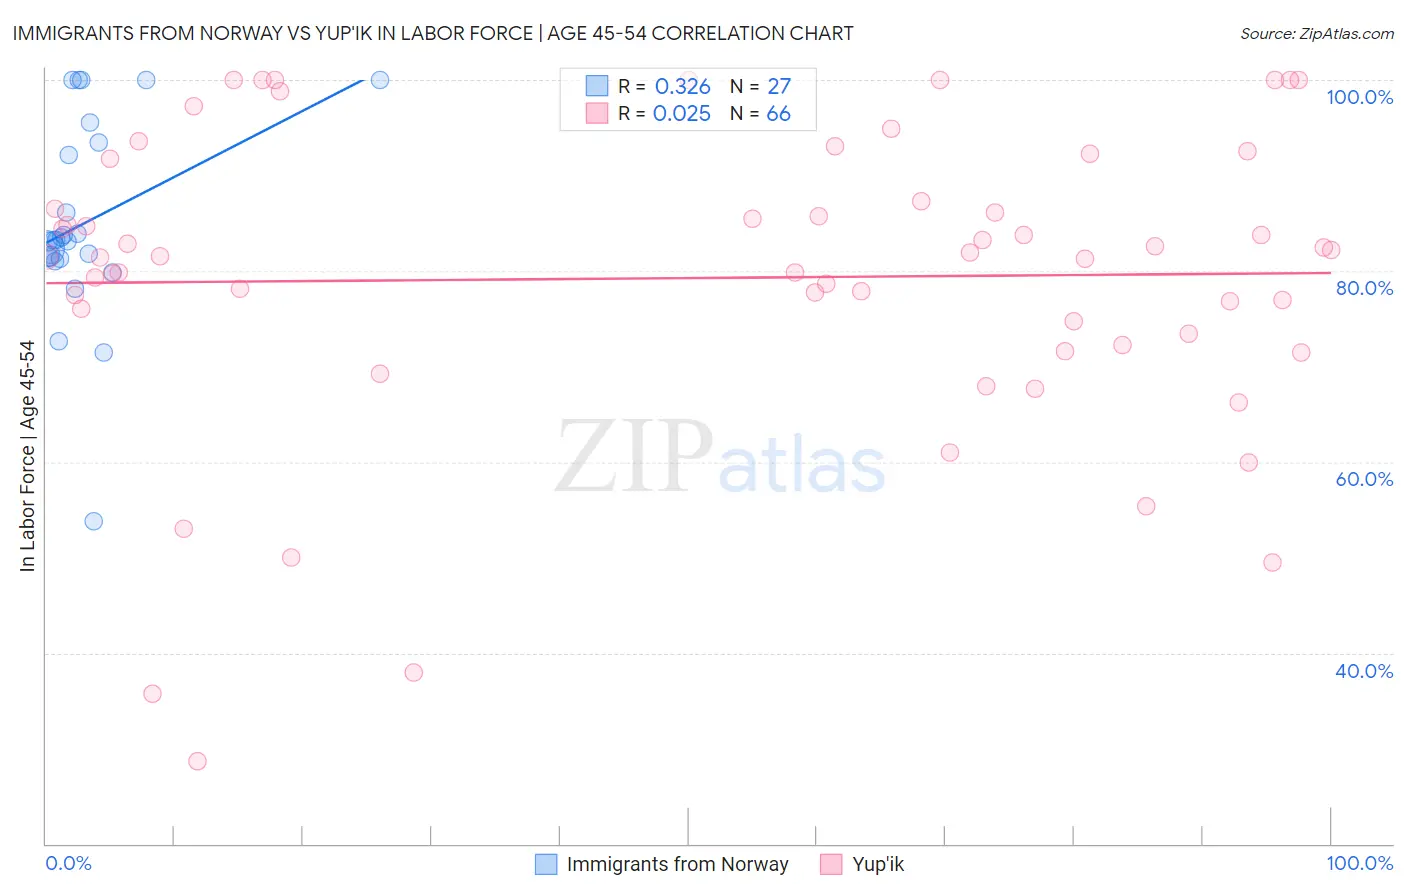
Immigrants from Norway vs Yup'ik In Labor Force | Age 45-54 Correlation Chart
The statistical analysis conducted on geographies consisting of 116,685,095 people shows a mild positive correlation between the proportion of Immigrants from Norway and labor force participation rate among population between the ages 45 and 54 in the United States with a correlation coefficient (R) of 0.326 and weighted average of 82.5%. Similarly, the statistical analysis conducted on geographies consisting of 39,957,049 people shows no correlation between the proportion of Yup'ik and labor force participation rate among population between the ages 45 and 54 in the United States with a correlation coefficient (R) of 0.025 and weighted average of 78.6%, a difference of 4.9%.
In Labor Force | Age 45-54 Correlation Summary
| Measurement | Immigrants from Norway | Yup'ik |
| Minimum | 53.8% | 28.6% |
| Maximum | 100.0% | 100.0% |
| Range | 46.2% | 71.4% |
| Mean | 85.1% | 79.3% |
| Median | 83.2% | 81.5% |
| Interquartile 25% (IQ1) | 81.3% | 73.5% |
| Interquartile 75% (IQ3) | 93.4% | 87.3% |
| Interquartile Range (IQR) | 12.1% | 13.8% |
| Standard Deviation (Sample) | 10.4% | 15.9% |
| Standard Deviation (Population) | 10.2% | 15.8% |
Similar Demographics by In Labor Force | Age 45-54
Demographics Similar to Immigrants from Norway by In Labor Force | Age 45-54
In terms of in labor force | age 45-54, the demographic groups most similar to Immigrants from Norway are Immigrants from Iraq (82.5%, a difference of 0.0%), Australian (82.5%, a difference of 0.0%), Immigrants from Canada (82.5%, a difference of 0.010%), Armenian (82.5%, a difference of 0.030%), and Immigrants from North America (82.5%, a difference of 0.030%).
| Demographics | Rating | Rank | In Labor Force | Age 45-54 |
| Immigrants | Costa Rica | 28.3 /100 | #187 | Fair 82.6% |
| South Africans | 28.0 /100 | #188 | Fair 82.6% |
| Syrians | 26.0 /100 | #189 | Fair 82.6% |
| British | 25.7 /100 | #190 | Fair 82.6% |
| Armenians | 23.2 /100 | #191 | Fair 82.5% |
| Immigrants | Iraq | 20.9 /100 | #192 | Fair 82.5% |
| Australians | 20.8 /100 | #193 | Fair 82.5% |
| Immigrants | Norway | 20.7 /100 | #194 | Fair 82.5% |
| Immigrants | Canada | 20.0 /100 | #195 | Fair 82.5% |
| Immigrants | North America | 18.8 /100 | #196 | Poor 82.5% |
| Lebanese | 18.2 /100 | #197 | Poor 82.5% |
| Immigrants | Denmark | 17.9 /100 | #198 | Poor 82.5% |
| Moroccans | 15.7 /100 | #199 | Poor 82.5% |
| French Canadians | 15.4 /100 | #200 | Poor 82.5% |
| Canadians | 15.1 /100 | #201 | Poor 82.4% |
Demographics Similar to Yup'ik by In Labor Force | Age 45-54
In terms of in labor force | age 45-54, the demographic groups most similar to Yup'ik are Yaqui (78.9%, a difference of 0.30%), Cherokee (79.0%, a difference of 0.40%), Crow (78.3%, a difference of 0.41%), Kiowa (78.3%, a difference of 0.49%), and Chickasaw (79.0%, a difference of 0.51%).
| Demographics | Rating | Rank | In Labor Force | Age 45-54 |
| Ottawa | 0.0 /100 | #314 | Tragic 79.5% |
| Blacks/African Americans | 0.0 /100 | #315 | Tragic 79.3% |
| Shoshone | 0.0 /100 | #316 | Tragic 79.3% |
| Comanche | 0.0 /100 | #317 | Tragic 79.2% |
| Chickasaw | 0.0 /100 | #318 | Tragic 79.0% |
| Cherokee | 0.0 /100 | #319 | Tragic 79.0% |
| Yaqui | 0.0 /100 | #320 | Tragic 78.9% |
| Yup'ik | 0.0 /100 | #321 | Tragic 78.6% |
| Crow | 0.0 /100 | #322 | Tragic 78.3% |
| Kiowa | 0.0 /100 | #323 | Tragic 78.3% |
| Dutch West Indians | 0.0 /100 | #324 | Tragic 78.2% |
| Choctaw | 0.0 /100 | #325 | Tragic 78.2% |
| Seminole | 0.0 /100 | #326 | Tragic 78.1% |
| Cajuns | 0.0 /100 | #327 | Tragic 78.1% |
| Sioux | 0.0 /100 | #328 | Tragic 78.0% |