Austrian vs Immigrants from Guyana In Labor Force | Age 20-24
COMPARE
Austrian
Immigrants from Guyana
In Labor Force | Age 20-24
In Labor Force | Age 20-24 Comparison
Austrians
Immigrants from Guyana
76.5%
IN LABOR FORCE | AGE 20-24
99.4/ 100
METRIC RATING
84th/ 347
METRIC RANK
69.3%
IN LABOR FORCE | AGE 20-24
0.0/ 100
METRIC RATING
336th/ 347
METRIC RANK
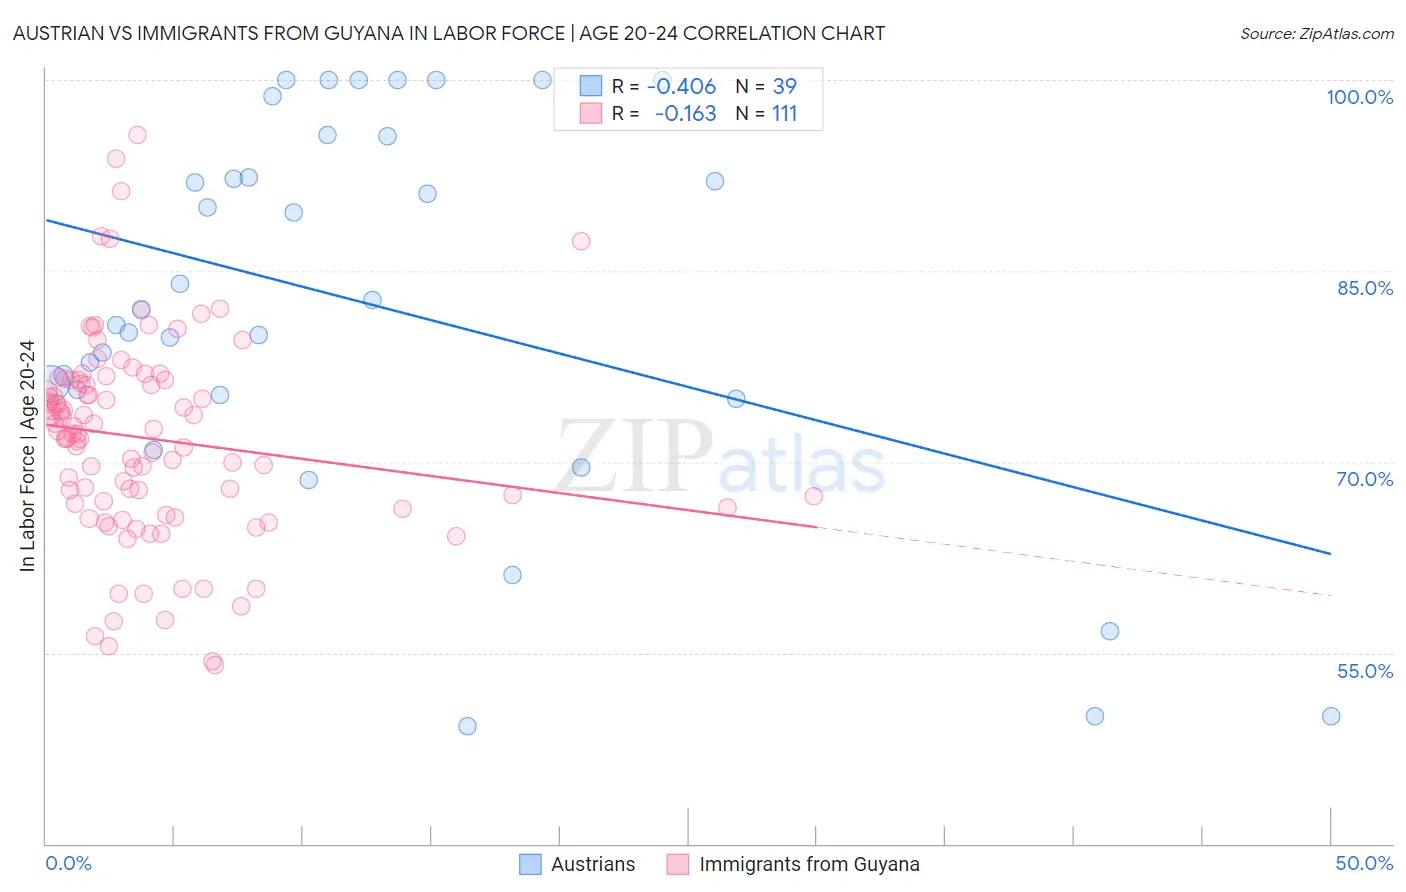
Austrian vs Immigrants from Guyana In Labor Force | Age 20-24 Correlation Chart
The statistical analysis conducted on geographies consisting of 451,655,464 people shows a moderate negative correlation between the proportion of Austrians and labor force participation rate among population between the ages 20 and 24 in the United States with a correlation coefficient (R) of -0.406 and weighted average of 76.5%. Similarly, the statistical analysis conducted on geographies consisting of 183,673,917 people shows a poor negative correlation between the proportion of Immigrants from Guyana and labor force participation rate among population between the ages 20 and 24 in the United States with a correlation coefficient (R) of -0.163 and weighted average of 69.3%, a difference of 10.4%.
In Labor Force | Age 20-24 Correlation Summary
| Measurement | Austrian | Immigrants from Guyana |
| Minimum | 49.2% | 54.0% |
| Maximum | 100.0% | 95.7% |
| Range | 50.8% | 41.7% |
| Mean | 82.3% | 71.9% |
| Median | 81.9% | 72.4% |
| Interquartile 25% (IQ1) | 75.3% | 66.7% |
| Interquartile 75% (IQ3) | 95.6% | 76.4% |
| Interquartile Range (IQR) | 20.3% | 9.7% |
| Standard Deviation (Sample) | 14.9% | 7.9% |
| Standard Deviation (Population) | 14.7% | 7.8% |
Similar Demographics by In Labor Force | Age 20-24
Demographics Similar to Austrians by In Labor Force | Age 20-24
In terms of in labor force | age 20-24, the demographic groups most similar to Austrians are Carpatho Rusyn (76.5%, a difference of 0.010%), Portuguese (76.4%, a difference of 0.030%), Immigrants from Iraq (76.4%, a difference of 0.050%), Immigrants from Thailand (76.4%, a difference of 0.050%), and Basque (76.5%, a difference of 0.10%).
| Demographics | Rating | Rank | In Labor Force | Age 20-24 |
| Immigrants | Cameroon | 99.6 /100 | #77 | Exceptional 76.6% |
| Canadians | 99.6 /100 | #78 | Exceptional 76.6% |
| Immigrants | Zaire | 99.6 /100 | #79 | Exceptional 76.6% |
| Italians | 99.6 /100 | #80 | Exceptional 76.5% |
| Basques | 99.5 /100 | #81 | Exceptional 76.5% |
| Hmong | 99.5 /100 | #82 | Exceptional 76.5% |
| Carpatho Rusyns | 99.4 /100 | #83 | Exceptional 76.5% |
| Austrians | 99.4 /100 | #84 | Exceptional 76.5% |
| Portuguese | 99.3 /100 | #85 | Exceptional 76.4% |
| Immigrants | Iraq | 99.3 /100 | #86 | Exceptional 76.4% |
| Immigrants | Thailand | 99.3 /100 | #87 | Exceptional 76.4% |
| Spanish | 99.2 /100 | #88 | Exceptional 76.4% |
| Bulgarians | 99.2 /100 | #89 | Exceptional 76.4% |
| Immigrants | Burma/Myanmar | 99.1 /100 | #90 | Exceptional 76.3% |
| Sierra Leoneans | 99.0 /100 | #91 | Exceptional 76.3% |
Demographics Similar to Immigrants from Guyana by In Labor Force | Age 20-24
In terms of in labor force | age 20-24, the demographic groups most similar to Immigrants from Guyana are Guyanese (69.2%, a difference of 0.13%), Pima (69.0%, a difference of 0.39%), Immigrants from Yemen (68.9%, a difference of 0.52%), Immigrants from Barbados (69.7%, a difference of 0.66%), and Menominee (68.7%, a difference of 0.83%).
| Demographics | Rating | Rank | In Labor Force | Age 20-24 |
| Yup'ik | 0.0 /100 | #329 | Tragic 70.9% |
| Vietnamese | 0.0 /100 | #330 | Tragic 70.6% |
| Immigrants | Bangladesh | 0.0 /100 | #331 | Tragic 70.6% |
| Immigrants | Uzbekistan | 0.0 /100 | #332 | Tragic 70.4% |
| Yuman | 0.0 /100 | #333 | Tragic 70.3% |
| British West Indians | 0.0 /100 | #334 | Tragic 70.0% |
| Immigrants | Barbados | 0.0 /100 | #335 | Tragic 69.7% |
| Immigrants | Guyana | 0.0 /100 | #336 | Tragic 69.3% |
| Guyanese | 0.0 /100 | #337 | Tragic 69.2% |
| Pima | 0.0 /100 | #338 | Tragic 69.0% |
| Immigrants | Yemen | 0.0 /100 | #339 | Tragic 68.9% |
| Menominee | 0.0 /100 | #340 | Tragic 68.7% |
| Tohono O'odham | 0.0 /100 | #341 | Tragic 68.6% |
| Immigrants | St. Vincent and the Grenadines | 0.0 /100 | #342 | Tragic 68.4% |
| Puerto Ricans | 0.0 /100 | #343 | Tragic 68.3% |