Maltese vs Hmong In Labor Force | Age 25-29
COMPARE
Maltese
Hmong
In Labor Force | Age 25-29
In Labor Force | Age 25-29 Comparison
Maltese
Hmong
86.0%
IN LABOR FORCE | AGE 25-29
100.0/ 100
METRIC RATING
21st/ 347
METRIC RANK
83.7%
IN LABOR FORCE | AGE 25-29
0.3/ 100
METRIC RATING
249th/ 347
METRIC RANK
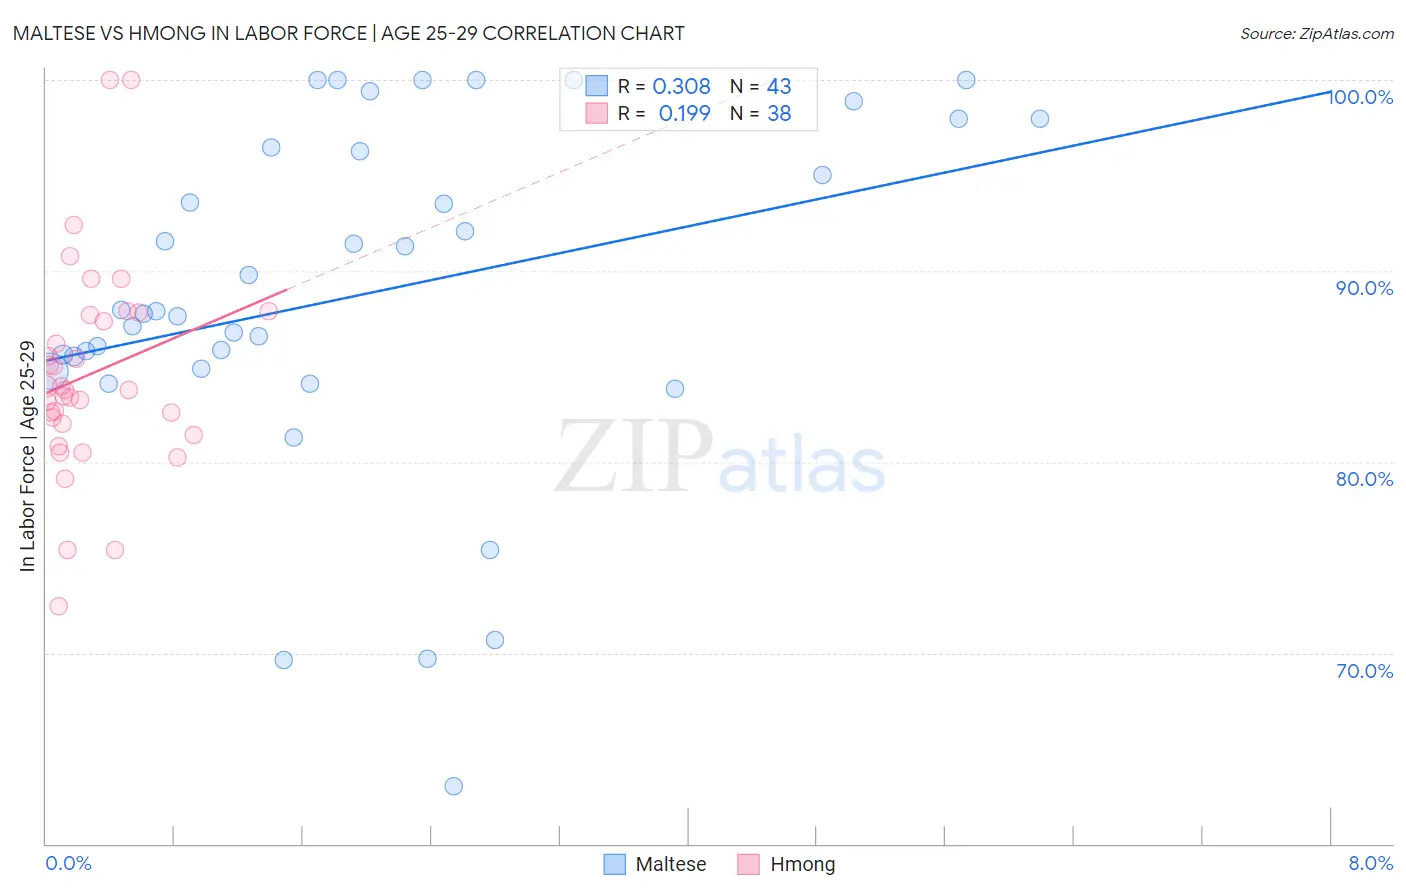
Maltese vs Hmong In Labor Force | Age 25-29 Correlation Chart
The statistical analysis conducted on geographies consisting of 126,432,251 people shows a mild positive correlation between the proportion of Maltese and labor force participation rate among population between the ages 25 and 29 in the United States with a correlation coefficient (R) of 0.308 and weighted average of 86.0%. Similarly, the statistical analysis conducted on geographies consisting of 24,664,732 people shows a poor positive correlation between the proportion of Hmong and labor force participation rate among population between the ages 25 and 29 in the United States with a correlation coefficient (R) of 0.199 and weighted average of 83.7%, a difference of 2.7%.
In Labor Force | Age 25-29 Correlation Summary
| Measurement | Maltese | Hmong |
| Minimum | 63.0% | 72.4% |
| Maximum | 100.0% | 100.0% |
| Range | 37.0% | 27.6% |
| Mean | 88.8% | 84.6% |
| Median | 87.9% | 83.8% |
| Interquartile 25% (IQ1) | 84.9% | 82.0% |
| Interquartile 75% (IQ3) | 96.5% | 87.7% |
| Interquartile Range (IQR) | 11.6% | 5.7% |
| Standard Deviation (Sample) | 9.1% | 5.5% |
| Standard Deviation (Population) | 9.0% | 5.5% |
Similar Demographics by In Labor Force | Age 25-29
Demographics Similar to Maltese by In Labor Force | Age 25-29
In terms of in labor force | age 25-29, the demographic groups most similar to Maltese are Immigrants from Ireland (86.0%, a difference of 0.010%), Cambodian (86.0%, a difference of 0.010%), Cape Verdean (86.0%, a difference of 0.020%), Bulgarian (86.0%, a difference of 0.030%), and Immigrants from Uganda (86.0%, a difference of 0.030%).
| Demographics | Rating | Rank | In Labor Force | Age 25-29 |
| Latvians | 100.0 /100 | #14 | Exceptional 86.1% |
| Bolivians | 100.0 /100 | #15 | Exceptional 86.1% |
| Immigrants | Bolivia | 100.0 /100 | #16 | Exceptional 86.1% |
| Bermudans | 100.0 /100 | #17 | Exceptional 86.0% |
| Bulgarians | 100.0 /100 | #18 | Exceptional 86.0% |
| Cape Verdeans | 100.0 /100 | #19 | Exceptional 86.0% |
| Immigrants | Ireland | 100.0 /100 | #20 | Exceptional 86.0% |
| Maltese | 100.0 /100 | #21 | Exceptional 86.0% |
| Cambodians | 100.0 /100 | #22 | Exceptional 86.0% |
| Immigrants | Uganda | 100.0 /100 | #23 | Exceptional 86.0% |
| Immigrants | Eastern Africa | 100.0 /100 | #24 | Exceptional 86.0% |
| Sudanese | 100.0 /100 | #25 | Exceptional 85.9% |
| Immigrants | North Macedonia | 100.0 /100 | #26 | Exceptional 85.9% |
| Paraguayans | 100.0 /100 | #27 | Exceptional 85.9% |
| Ugandans | 100.0 /100 | #28 | Exceptional 85.9% |
Demographics Similar to Hmong by In Labor Force | Age 25-29
In terms of in labor force | age 25-29, the demographic groups most similar to Hmong are Nonimmigrants (83.7%, a difference of 0.010%), Central American (83.7%, a difference of 0.020%), Immigrants from El Salvador (83.7%, a difference of 0.030%), Bahamian (83.7%, a difference of 0.030%), and Cree (83.8%, a difference of 0.040%).
| Demographics | Rating | Rank | In Labor Force | Age 25-29 |
| U.S. Virgin Islanders | 0.6 /100 | #242 | Tragic 83.8% |
| Salvadorans | 0.5 /100 | #243 | Tragic 83.8% |
| Immigrants | Jamaica | 0.4 /100 | #244 | Tragic 83.8% |
| Iroquois | 0.4 /100 | #245 | Tragic 83.8% |
| Cree | 0.3 /100 | #246 | Tragic 83.8% |
| Immigrants | El Salvador | 0.3 /100 | #247 | Tragic 83.7% |
| Immigrants | Nonimmigrants | 0.3 /100 | #248 | Tragic 83.7% |
| Hmong | 0.3 /100 | #249 | Tragic 83.7% |
| Central Americans | 0.2 /100 | #250 | Tragic 83.7% |
| Bahamians | 0.2 /100 | #251 | Tragic 83.7% |
| Guatemalans | 0.2 /100 | #252 | Tragic 83.7% |
| Immigrants | Trinidad and Tobago | 0.2 /100 | #253 | Tragic 83.7% |
| Spaniards | 0.2 /100 | #254 | Tragic 83.7% |
| Haitians | 0.2 /100 | #255 | Tragic 83.7% |
| Immigrants | Haiti | 0.2 /100 | #256 | Tragic 83.7% |