Immigrants from Netherlands vs Black/African American In Labor Force | Age 35-44
COMPARE
Immigrants from Netherlands
Black/African American
In Labor Force | Age 35-44
In Labor Force | Age 35-44 Comparison
Immigrants from Netherlands
Blacks/African Americans
84.5%
IN LABOR FORCE | AGE 35-44
76.6/ 100
METRIC RATING
147th/ 347
METRIC RANK
82.2%
IN LABOR FORCE | AGE 35-44
0.0/ 100
METRIC RATING
306th/ 347
METRIC RANK
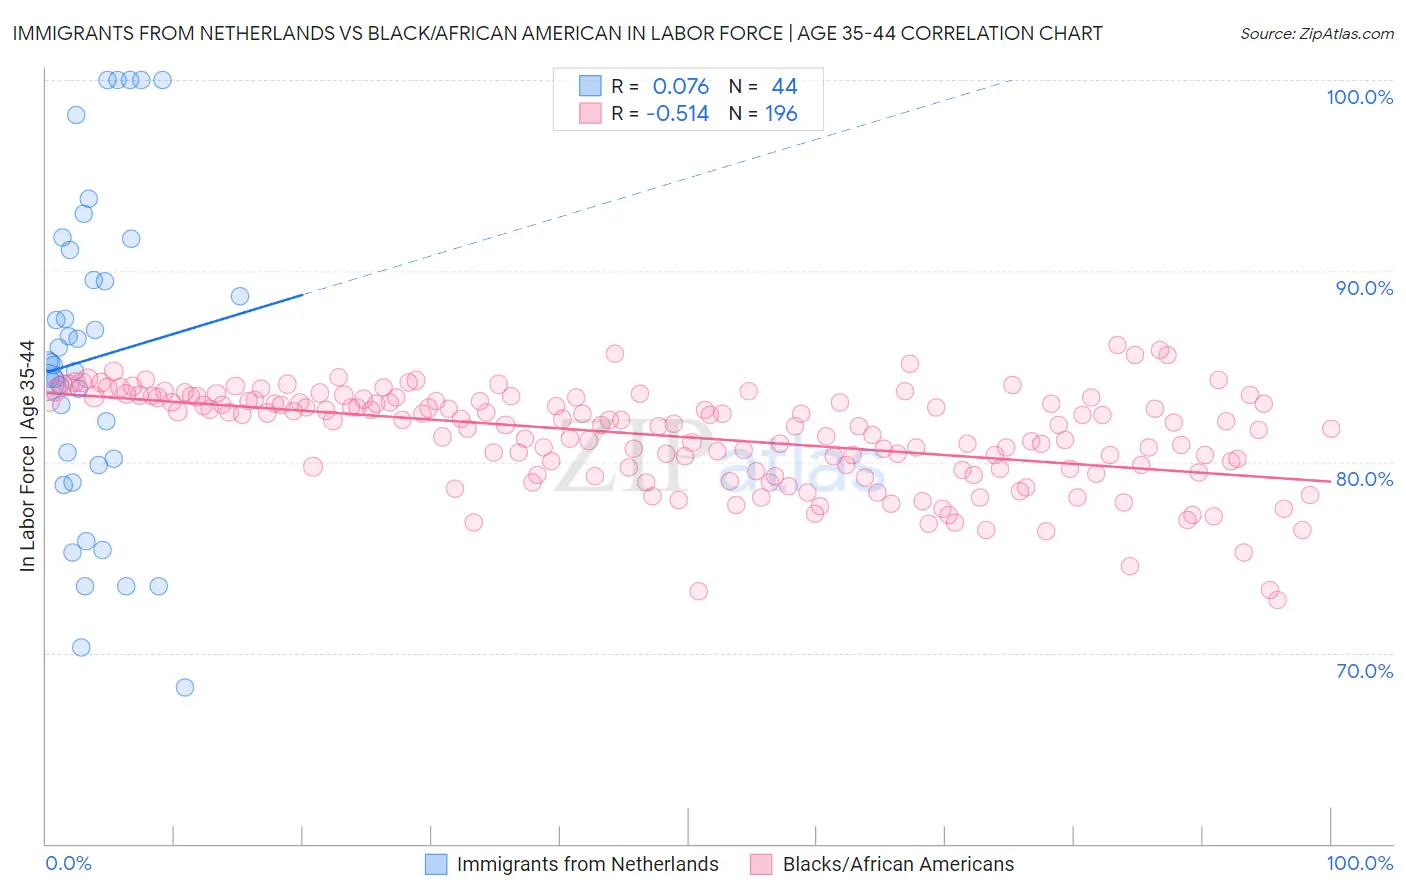
Immigrants from Netherlands vs Black/African American In Labor Force | Age 35-44 Correlation Chart
The statistical analysis conducted on geographies consisting of 237,801,215 people shows a slight positive correlation between the proportion of Immigrants from Netherlands and labor force participation rate among population between the ages 35 and 44 in the United States with a correlation coefficient (R) of 0.076 and weighted average of 84.5%. Similarly, the statistical analysis conducted on geographies consisting of 565,288,812 people shows a substantial negative correlation between the proportion of Blacks/African Americans and labor force participation rate among population between the ages 35 and 44 in the United States with a correlation coefficient (R) of -0.514 and weighted average of 82.2%, a difference of 2.9%.
In Labor Force | Age 35-44 Correlation Summary
| Measurement | Immigrants from Netherlands | Black/African American |
| Minimum | 68.2% | 72.8% |
| Maximum | 100.0% | 86.2% |
| Range | 31.8% | 13.4% |
| Mean | 85.4% | 81.3% |
| Median | 85.1% | 82.0% |
| Interquartile 25% (IQ1) | 80.0% | 79.6% |
| Interquartile 75% (IQ3) | 90.3% | 83.2% |
| Interquartile Range (IQR) | 10.3% | 3.6% |
| Standard Deviation (Sample) | 8.3% | 2.6% |
| Standard Deviation (Population) | 8.2% | 2.6% |
Similar Demographics by In Labor Force | Age 35-44
Demographics Similar to Immigrants from Netherlands by In Labor Force | Age 35-44
In terms of in labor force | age 35-44, the demographic groups most similar to Immigrants from Netherlands are Immigrants from Asia (84.5%, a difference of 0.020%), Immigrants from Uruguay (84.6%, a difference of 0.030%), Immigrants from Ukraine (84.6%, a difference of 0.030%), Immigrants from Jamaica (84.6%, a difference of 0.030%), and Immigrants from Saudi Arabia (84.6%, a difference of 0.030%).
| Demographics | Rating | Rank | In Labor Force | Age 35-44 |
| Immigrants | Japan | 81.4 /100 | #140 | Excellent 84.6% |
| Immigrants | Belgium | 80.8 /100 | #141 | Excellent 84.6% |
| Immigrants | Uruguay | 80.1 /100 | #142 | Excellent 84.6% |
| Immigrants | Ukraine | 79.7 /100 | #143 | Good 84.6% |
| Immigrants | Jamaica | 79.4 /100 | #144 | Good 84.6% |
| Immigrants | Saudi Arabia | 79.4 /100 | #145 | Good 84.6% |
| Immigrants | Asia | 78.7 /100 | #146 | Good 84.5% |
| Immigrants | Netherlands | 76.6 /100 | #147 | Good 84.5% |
| South American Indians | 73.6 /100 | #148 | Good 84.5% |
| Okinawans | 73.5 /100 | #149 | Good 84.5% |
| Immigrants | Nigeria | 73.3 /100 | #150 | Good 84.5% |
| Romanians | 72.1 /100 | #151 | Good 84.5% |
| Immigrants | Taiwan | 71.4 /100 | #152 | Good 84.5% |
| Trinidadians and Tobagonians | 69.5 /100 | #153 | Good 84.5% |
| Iranians | 69.4 /100 | #154 | Good 84.5% |
Demographics Similar to Blacks/African Americans by In Labor Force | Age 35-44
In terms of in labor force | age 35-44, the demographic groups most similar to Blacks/African Americans are Shoshone (82.2%, a difference of 0.020%), Hispanic or Latino (82.1%, a difference of 0.10%), Immigrants from Central America (82.0%, a difference of 0.25%), Cree (82.0%, a difference of 0.25%), and Marshallese (82.4%, a difference of 0.29%).
| Demographics | Rating | Rank | In Labor Force | Age 35-44 |
| Tlingit-Haida | 0.0 /100 | #299 | Tragic 82.5% |
| Central American Indians | 0.0 /100 | #300 | Tragic 82.5% |
| Spanish American Indians | 0.0 /100 | #301 | Tragic 82.5% |
| Americans | 0.0 /100 | #302 | Tragic 82.4% |
| Nepalese | 0.0 /100 | #303 | Tragic 82.4% |
| Marshallese | 0.0 /100 | #304 | Tragic 82.4% |
| Shoshone | 0.0 /100 | #305 | Tragic 82.2% |
| Blacks/African Americans | 0.0 /100 | #306 | Tragic 82.2% |
| Hispanics or Latinos | 0.0 /100 | #307 | Tragic 82.1% |
| Immigrants | Central America | 0.0 /100 | #308 | Tragic 82.0% |
| Cree | 0.0 /100 | #309 | Tragic 82.0% |
| Blackfeet | 0.0 /100 | #310 | Tragic 81.9% |
| Colville | 0.0 /100 | #311 | Tragic 81.7% |
| Alaska Natives | 0.0 /100 | #312 | Tragic 81.6% |
| Mexicans | 0.0 /100 | #313 | Tragic 81.6% |