Immigrants from Netherlands vs Nonimmigrants In Labor Force | Age 35-44
COMPARE
Immigrants from Netherlands
Nonimmigrants
In Labor Force | Age 35-44
In Labor Force | Age 35-44 Comparison
Immigrants from Netherlands
Nonimmigrants
84.5%
IN LABOR FORCE | AGE 35-44
76.6/ 100
METRIC RATING
147th/ 347
METRIC RANK
83.2%
IN LABOR FORCE | AGE 35-44
0.0/ 100
METRIC RATING
274th/ 347
METRIC RANK
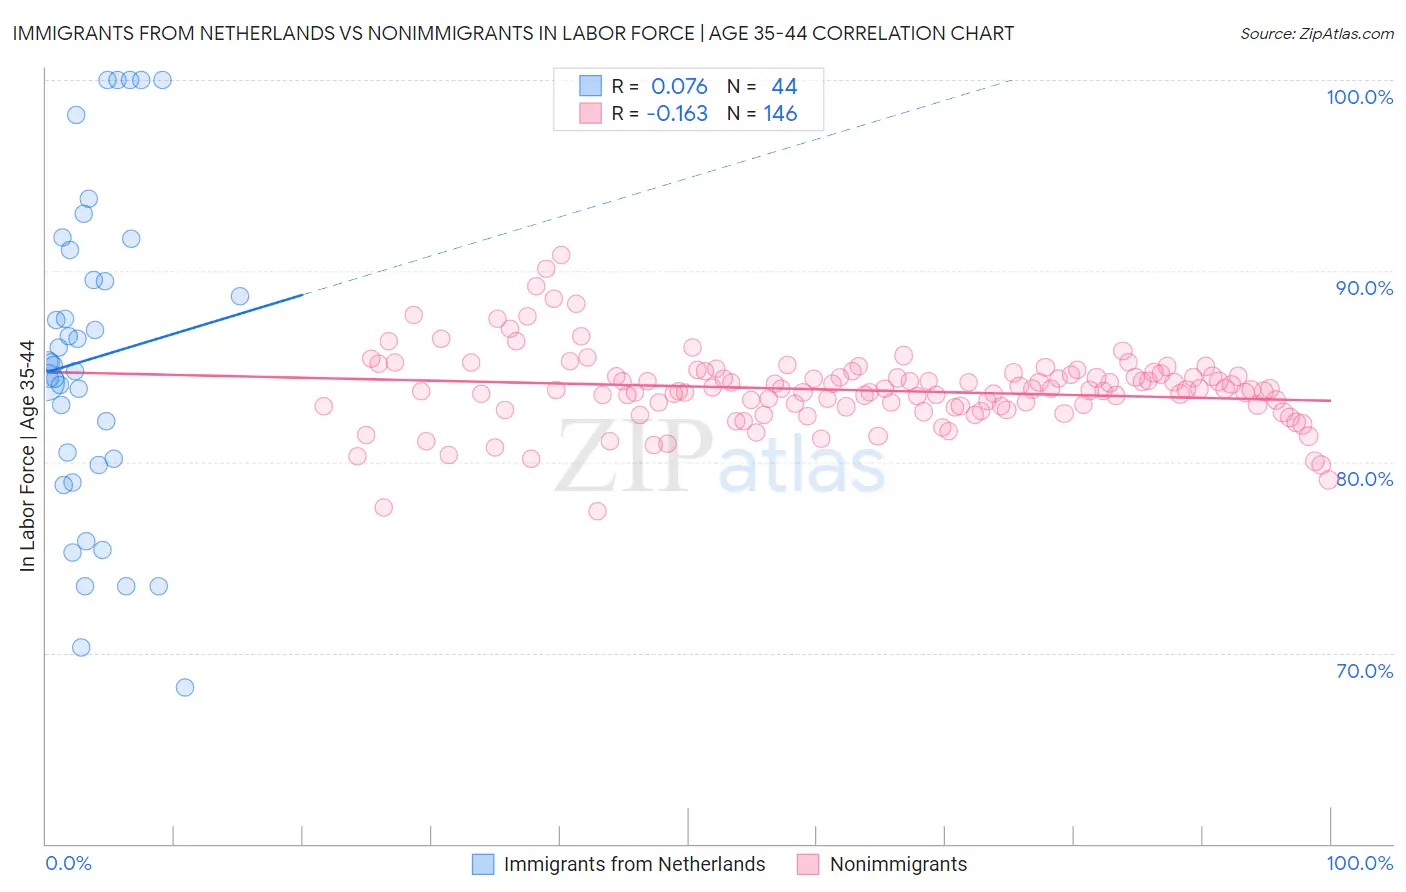
Immigrants from Netherlands vs Nonimmigrants In Labor Force | Age 35-44 Correlation Chart
The statistical analysis conducted on geographies consisting of 237,801,215 people shows a slight positive correlation between the proportion of Immigrants from Netherlands and labor force participation rate among population between the ages 35 and 44 in the United States with a correlation coefficient (R) of 0.076 and weighted average of 84.5%. Similarly, the statistical analysis conducted on geographies consisting of 584,065,526 people shows a poor negative correlation between the proportion of Nonimmigrants and labor force participation rate among population between the ages 35 and 44 in the United States with a correlation coefficient (R) of -0.163 and weighted average of 83.2%, a difference of 1.6%.
In Labor Force | Age 35-44 Correlation Summary
| Measurement | Immigrants from Netherlands | Nonimmigrants |
| Minimum | 68.2% | 77.4% |
| Maximum | 100.0% | 90.8% |
| Range | 31.8% | 13.4% |
| Mean | 85.4% | 83.8% |
| Median | 85.1% | 83.8% |
| Interquartile 25% (IQ1) | 80.0% | 82.9% |
| Interquartile 75% (IQ3) | 90.3% | 84.6% |
| Interquartile Range (IQR) | 10.3% | 1.7% |
| Standard Deviation (Sample) | 8.3% | 2.0% |
| Standard Deviation (Population) | 8.2% | 2.0% |
Similar Demographics by In Labor Force | Age 35-44
Demographics Similar to Immigrants from Netherlands by In Labor Force | Age 35-44
In terms of in labor force | age 35-44, the demographic groups most similar to Immigrants from Netherlands are Immigrants from Asia (84.5%, a difference of 0.020%), Immigrants from Uruguay (84.6%, a difference of 0.030%), Immigrants from Ukraine (84.6%, a difference of 0.030%), Immigrants from Jamaica (84.6%, a difference of 0.030%), and Immigrants from Saudi Arabia (84.6%, a difference of 0.030%).
| Demographics | Rating | Rank | In Labor Force | Age 35-44 |
| Immigrants | Japan | 81.4 /100 | #140 | Excellent 84.6% |
| Immigrants | Belgium | 80.8 /100 | #141 | Excellent 84.6% |
| Immigrants | Uruguay | 80.1 /100 | #142 | Excellent 84.6% |
| Immigrants | Ukraine | 79.7 /100 | #143 | Good 84.6% |
| Immigrants | Jamaica | 79.4 /100 | #144 | Good 84.6% |
| Immigrants | Saudi Arabia | 79.4 /100 | #145 | Good 84.6% |
| Immigrants | Asia | 78.7 /100 | #146 | Good 84.5% |
| Immigrants | Netherlands | 76.6 /100 | #147 | Good 84.5% |
| South American Indians | 73.6 /100 | #148 | Good 84.5% |
| Okinawans | 73.5 /100 | #149 | Good 84.5% |
| Immigrants | Nigeria | 73.3 /100 | #150 | Good 84.5% |
| Romanians | 72.1 /100 | #151 | Good 84.5% |
| Immigrants | Taiwan | 71.4 /100 | #152 | Good 84.5% |
| Trinidadians and Tobagonians | 69.5 /100 | #153 | Good 84.5% |
| Iranians | 69.4 /100 | #154 | Good 84.5% |
Demographics Similar to Nonimmigrants by In Labor Force | Age 35-44
In terms of in labor force | age 35-44, the demographic groups most similar to Nonimmigrants are Immigrants from Fiji (83.2%, a difference of 0.020%), Spanish (83.2%, a difference of 0.020%), Hawaiian (83.2%, a difference of 0.020%), Delaware (83.2%, a difference of 0.030%), and Samoan (83.2%, a difference of 0.030%).
| Demographics | Rating | Rank | In Labor Force | Age 35-44 |
| Guamanians/Chamorros | 0.1 /100 | #267 | Tragic 83.4% |
| Hondurans | 0.1 /100 | #268 | Tragic 83.4% |
| Immigrants | Grenada | 0.1 /100 | #269 | Tragic 83.3% |
| Immigrants | Honduras | 0.0 /100 | #270 | Tragic 83.3% |
| French American Indians | 0.0 /100 | #271 | Tragic 83.2% |
| Immigrants | Fiji | 0.0 /100 | #272 | Tragic 83.2% |
| Spanish | 0.0 /100 | #273 | Tragic 83.2% |
| Immigrants | Nonimmigrants | 0.0 /100 | #274 | Tragic 83.2% |
| Hawaiians | 0.0 /100 | #275 | Tragic 83.2% |
| Delaware | 0.0 /100 | #276 | Tragic 83.2% |
| Samoans | 0.0 /100 | #277 | Tragic 83.2% |
| Belizeans | 0.0 /100 | #278 | Tragic 83.1% |
| Immigrants | Micronesia | 0.0 /100 | #279 | Tragic 83.1% |
| Dominicans | 0.0 /100 | #280 | Tragic 83.1% |
| Guatemalans | 0.0 /100 | #281 | Tragic 83.0% |