Immigrants from Netherlands vs Crow Median Household Income
COMPARE
Immigrants from Netherlands
Crow
Median Household Income
Median Household Income Comparison
Immigrants from Netherlands
Crow
$94,411
MEDIAN HOUSEHOLD INCOME
99.7/ 100
METRIC RATING
64th/ 347
METRIC RANK
$63,681
MEDIAN HOUSEHOLD INCOME
0.0/ 100
METRIC RATING
341st/ 347
METRIC RANK
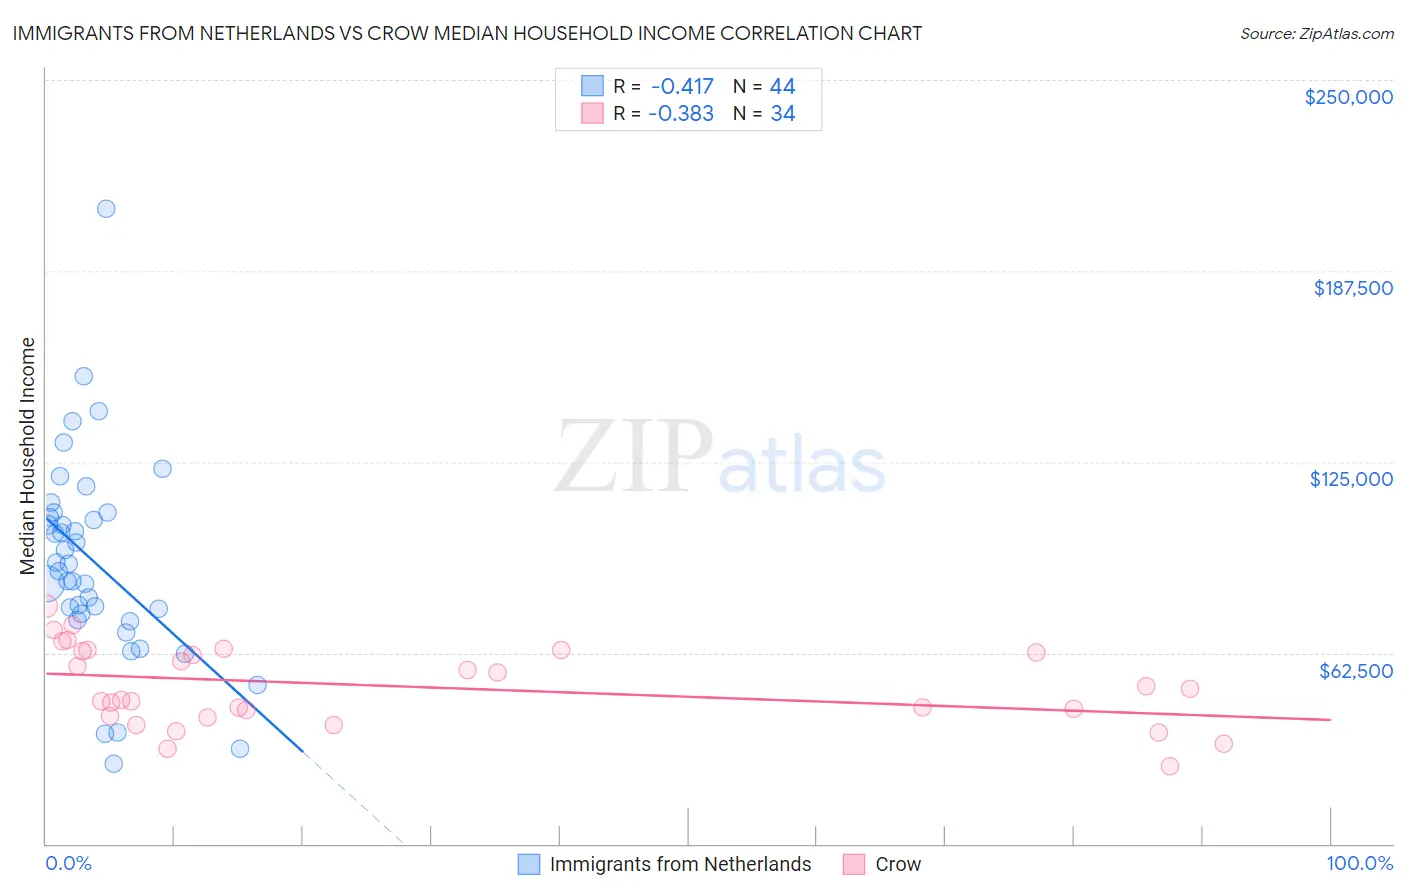
Immigrants from Netherlands vs Crow Median Household Income Correlation Chart
The statistical analysis conducted on geographies consisting of 237,766,506 people shows a moderate negative correlation between the proportion of Immigrants from Netherlands and median household income in the United States with a correlation coefficient (R) of -0.417 and weighted average of $94,411. Similarly, the statistical analysis conducted on geographies consisting of 59,197,360 people shows a mild negative correlation between the proportion of Crow and median household income in the United States with a correlation coefficient (R) of -0.383 and weighted average of $63,681, a difference of 48.3%.
Median Household Income Correlation Summary
| Measurement | Immigrants from Netherlands | Crow |
| Minimum | $26,321 | $25,179 |
| Maximum | $207,847 | $77,725 |
| Range | $181,526 | $52,546 |
| Mean | $92,018 | $51,476 |
| Median | $90,410 | $48,948 |
| Interquartile 25% (IQ1) | $74,172 | $41,650 |
| Interquartile 75% (IQ3) | $107,615 | $62,906 |
| Interquartile Range (IQR) | $33,443 | $21,256 |
| Standard Deviation (Sample) | $33,648 | $12,984 |
| Standard Deviation (Population) | $33,264 | $12,792 |
Similar Demographics by Median Household Income
Demographics Similar to Immigrants from Netherlands by Median Household Income
In terms of median household income, the demographic groups most similar to Immigrants from Netherlands are Immigrants from Belarus ($94,399, a difference of 0.010%), Immigrants from Romania ($94,222, a difference of 0.20%), Greek ($94,735, a difference of 0.34%), Immigrants from Scotland ($94,091, a difference of 0.34%), and Immigrants from Norway ($94,846, a difference of 0.46%).
| Demographics | Rating | Rank | Median Household Income |
| New Zealanders | 99.8 /100 | #57 | Exceptional $95,146 |
| Soviet Union | 99.8 /100 | #58 | Exceptional $95,098 |
| Immigrants | Europe | 99.8 /100 | #59 | Exceptional $95,032 |
| Koreans | 99.8 /100 | #60 | Exceptional $95,018 |
| Laotians | 99.8 /100 | #61 | Exceptional $94,990 |
| Immigrants | Norway | 99.8 /100 | #62 | Exceptional $94,846 |
| Greeks | 99.8 /100 | #63 | Exceptional $94,735 |
| Immigrants | Netherlands | 99.7 /100 | #64 | Exceptional $94,411 |
| Immigrants | Belarus | 99.7 /100 | #65 | Exceptional $94,399 |
| Immigrants | Romania | 99.7 /100 | #66 | Exceptional $94,222 |
| Immigrants | Scotland | 99.7 /100 | #67 | Exceptional $94,091 |
| Mongolians | 99.7 /100 | #68 | Exceptional $93,971 |
| Argentineans | 99.7 /100 | #69 | Exceptional $93,960 |
| Immigrants | Fiji | 99.7 /100 | #70 | Exceptional $93,933 |
| Immigrants | Philippines | 99.6 /100 | #71 | Exceptional $93,899 |
Demographics Similar to Crow by Median Household Income
In terms of median household income, the demographic groups most similar to Crow are Pima ($63,262, a difference of 0.66%), Pueblo ($64,692, a difference of 1.6%), Houma ($62,575, a difference of 1.8%), Hopi ($65,043, a difference of 2.1%), and Immigrants from Yemen ($65,194, a difference of 2.4%).
| Demographics | Rating | Rank | Median Household Income |
| Creek | 0.0 /100 | #333 | Tragic $67,715 |
| Blacks/African Americans | 0.0 /100 | #334 | Tragic $67,573 |
| Cheyenne | 0.0 /100 | #335 | Tragic $66,974 |
| Immigrants | Congo | 0.0 /100 | #336 | Tragic $66,768 |
| Kiowa | 0.0 /100 | #337 | Tragic $65,914 |
| Immigrants | Yemen | 0.0 /100 | #338 | Tragic $65,194 |
| Hopi | 0.0 /100 | #339 | Tragic $65,043 |
| Pueblo | 0.0 /100 | #340 | Tragic $64,692 |
| Crow | 0.0 /100 | #341 | Tragic $63,681 |
| Pima | 0.0 /100 | #342 | Tragic $63,262 |
| Houma | 0.0 /100 | #343 | Tragic $62,575 |
| Tohono O'odham | 0.0 /100 | #344 | Tragic $61,663 |
| Puerto Ricans | 0.0 /100 | #345 | Tragic $59,197 |
| Navajo | 0.0 /100 | #346 | Tragic $59,159 |
| Lumbee | 0.0 /100 | #347 | Tragic $54,644 |