Immigrants from Netherlands vs Crow 4th Grade
COMPARE
Immigrants from Netherlands
Crow
4th Grade
4th Grade Comparison
Immigrants from Netherlands
Crow
98.0%
4TH GRADE
99.3/ 100
METRIC RATING
75th/ 347
METRIC RANK
99.6%
4TH GRADE
100.0/ 100
METRIC RATING
1st/ 347
METRIC RANK
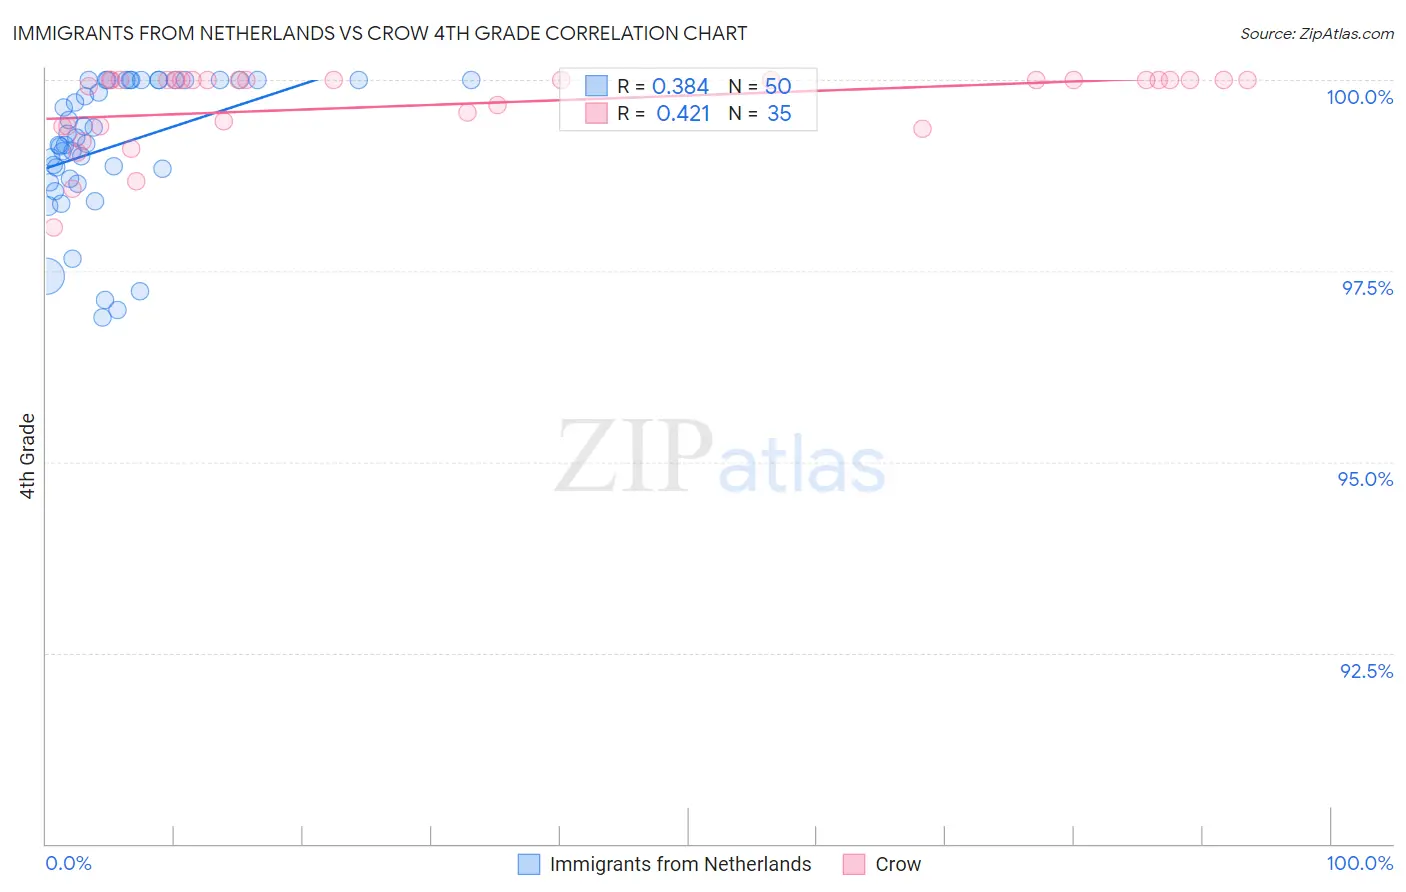
Immigrants from Netherlands vs Crow 4th Grade Correlation Chart
The statistical analysis conducted on geographies consisting of 237,869,934 people shows a mild positive correlation between the proportion of Immigrants from Netherlands and percentage of population with at least 4th grade education in the United States with a correlation coefficient (R) of 0.384 and weighted average of 98.0%. Similarly, the statistical analysis conducted on geographies consisting of 665,246 people shows a moderate positive correlation between the proportion of Crow and percentage of population with at least 4th grade education in the United States with a correlation coefficient (R) of 0.421 and weighted average of 99.6%, a difference of 1.6%.
4th Grade Correlation Summary
| Measurement | Immigrants from Netherlands | Crow |
| Minimum | 96.9% | 98.1% |
| Maximum | 100.0% | 100.0% |
| Range | 3.1% | 1.9% |
| Mean | 99.1% | 99.7% |
| Median | 99.2% | 100.0% |
| Interquartile 25% (IQ1) | 98.7% | 99.4% |
| Interquartile 75% (IQ3) | 100.0% | 100.0% |
| Interquartile Range (IQR) | 1.3% | 0.60% |
| Standard Deviation (Sample) | 0.90% | 0.50% |
| Standard Deviation (Population) | 0.89% | 0.49% |
Similar Demographics by 4th Grade
Demographics Similar to Immigrants from Netherlands by 4th Grade
In terms of 4th grade, the demographic groups most similar to Immigrants from Netherlands are Cherokee (98.0%, a difference of 0.0%), Immigrants from Lithuania (98.0%, a difference of 0.0%), Chickasaw (98.0%, a difference of 0.010%), Immigrants from England (98.0%, a difference of 0.010%), and Ukrainian (98.0%, a difference of 0.010%).
| Demographics | Rating | Rank | 4th Grade |
| Kiowa | 99.6 /100 | #68 | Exceptional 98.0% |
| Pueblo | 99.6 /100 | #69 | Exceptional 98.0% |
| Immigrants | Austria | 99.6 /100 | #70 | Exceptional 98.0% |
| Lumbee | 99.6 /100 | #71 | Exceptional 98.0% |
| Iranians | 99.4 /100 | #72 | Exceptional 98.0% |
| Macedonians | 99.4 /100 | #73 | Exceptional 98.0% |
| Chickasaw | 99.4 /100 | #74 | Exceptional 98.0% |
| Immigrants | Netherlands | 99.3 /100 | #75 | Exceptional 98.0% |
| Cherokee | 99.3 /100 | #76 | Exceptional 98.0% |
| Immigrants | Lithuania | 99.3 /100 | #77 | Exceptional 98.0% |
| Immigrants | England | 99.3 /100 | #78 | Exceptional 98.0% |
| Ukrainians | 99.2 /100 | #79 | Exceptional 98.0% |
| Osage | 99.2 /100 | #80 | Exceptional 98.0% |
| Immigrants | India | 99.1 /100 | #81 | Exceptional 98.0% |
| Icelanders | 99.1 /100 | #82 | Exceptional 98.0% |
Demographics Similar to Crow by 4th Grade
In terms of 4th grade, the demographic groups most similar to Crow are Welsh (98.7%, a difference of 0.88%), Tsimshian (98.6%, a difference of 0.94%), Inupiat (98.6%, a difference of 1.0%), Yup'ik (98.5%, a difference of 1.0%), and Norwegian (98.5%, a difference of 1.1%).
| Demographics | Rating | Rank | 4th Grade |
| Crow | 100.0 /100 | #1 | Exceptional 99.6% |
| Welsh | 100.0 /100 | #2 | Exceptional 98.7% |
| Tsimshian | 100.0 /100 | #3 | Exceptional 98.6% |
| Inupiat | 100.0 /100 | #4 | Exceptional 98.6% |
| Yup'ik | 100.0 /100 | #5 | Exceptional 98.5% |
| Norwegians | 100.0 /100 | #6 | Exceptional 98.5% |
| Slovaks | 100.0 /100 | #7 | Exceptional 98.5% |
| Germans | 100.0 /100 | #8 | Exceptional 98.5% |
| Slovenes | 100.0 /100 | #9 | Exceptional 98.4% |
| Alaskan Athabascans | 100.0 /100 | #10 | Exceptional 98.4% |
| English | 100.0 /100 | #11 | Exceptional 98.4% |
| Tlingit-Haida | 100.0 /100 | #12 | Exceptional 98.4% |
| Swedes | 100.0 /100 | #13 | Exceptional 98.4% |
| Carpatho Rusyns | 100.0 /100 | #14 | Exceptional 98.4% |
| Dutch | 100.0 /100 | #15 | Exceptional 98.4% |