Immigrants from Nepal vs Ukrainian In Labor Force | Age 30-34
COMPARE
Immigrants from Nepal
Ukrainian
In Labor Force | Age 30-34
In Labor Force | Age 30-34 Comparison
Immigrants from Nepal
Ukrainians
85.6%
IN LABOR FORCE | AGE 30-34
99.8/ 100
METRIC RATING
45th/ 347
METRIC RANK
85.2%
IN LABOR FORCE | AGE 30-34
96.6/ 100
METRIC RATING
103rd/ 347
METRIC RANK
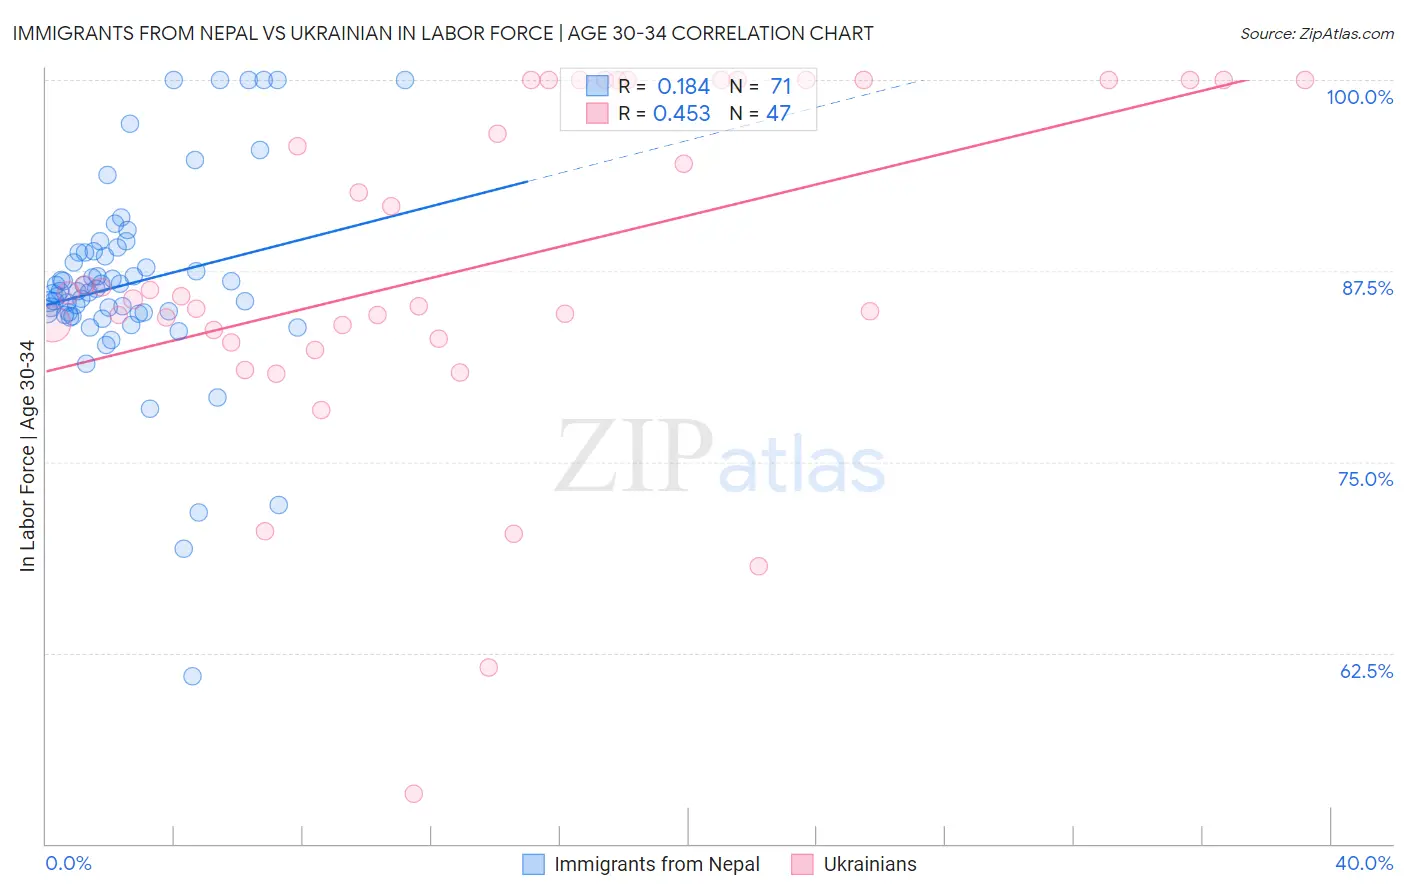
Immigrants from Nepal vs Ukrainian In Labor Force | Age 30-34 Correlation Chart
The statistical analysis conducted on geographies consisting of 186,729,132 people shows a poor positive correlation between the proportion of Immigrants from Nepal and labor force participation rate among population between the ages 30 and 34 in the United States with a correlation coefficient (R) of 0.184 and weighted average of 85.6%. Similarly, the statistical analysis conducted on geographies consisting of 448,215,384 people shows a moderate positive correlation between the proportion of Ukrainians and labor force participation rate among population between the ages 30 and 34 in the United States with a correlation coefficient (R) of 0.453 and weighted average of 85.2%, a difference of 0.51%.
In Labor Force | Age 30-34 Correlation Summary
| Measurement | Immigrants from Nepal | Ukrainian |
| Minimum | 61.0% | 53.3% |
| Maximum | 100.0% | 100.0% |
| Range | 39.0% | 46.7% |
| Mean | 86.7% | 87.8% |
| Median | 86.2% | 85.8% |
| Interquartile 25% (IQ1) | 84.7% | 83.0% |
| Interquartile 75% (IQ3) | 88.7% | 100.0% |
| Interquartile Range (IQR) | 4.1% | 17.0% |
| Standard Deviation (Sample) | 6.7% | 11.1% |
| Standard Deviation (Population) | 6.6% | 10.9% |
Similar Demographics by In Labor Force | Age 30-34
Demographics Similar to Immigrants from Nepal by In Labor Force | Age 30-34
In terms of in labor force | age 30-34, the demographic groups most similar to Immigrants from Nepal are Immigrants from Sri Lanka (85.6%, a difference of 0.010%), Immigrants from Morocco (85.6%, a difference of 0.010%), Croatian (85.6%, a difference of 0.010%), Immigrants from Lithuania (85.6%, a difference of 0.030%), and Immigrants from Sweden (85.6%, a difference of 0.030%).
| Demographics | Rating | Rank | In Labor Force | Age 30-34 |
| Immigrants | Greece | 99.9 /100 | #38 | Exceptional 85.7% |
| Eastern Europeans | 99.9 /100 | #39 | Exceptional 85.7% |
| Turks | 99.9 /100 | #40 | Exceptional 85.7% |
| Immigrants | Italy | 99.9 /100 | #41 | Exceptional 85.7% |
| Zimbabweans | 99.8 /100 | #42 | Exceptional 85.6% |
| Immigrants | Lithuania | 99.8 /100 | #43 | Exceptional 85.6% |
| Immigrants | Sri Lanka | 99.8 /100 | #44 | Exceptional 85.6% |
| Immigrants | Nepal | 99.8 /100 | #45 | Exceptional 85.6% |
| Immigrants | Morocco | 99.8 /100 | #46 | Exceptional 85.6% |
| Croatians | 99.8 /100 | #47 | Exceptional 85.6% |
| Immigrants | Sweden | 99.8 /100 | #48 | Exceptional 85.6% |
| Lithuanians | 99.8 /100 | #49 | Exceptional 85.6% |
| Immigrants | Australia | 99.8 /100 | #50 | Exceptional 85.6% |
| Cape Verdeans | 99.7 /100 | #51 | Exceptional 85.6% |
| Slovenes | 99.7 /100 | #52 | Exceptional 85.6% |
Demographics Similar to Ukrainians by In Labor Force | Age 30-34
In terms of in labor force | age 30-34, the demographic groups most similar to Ukrainians are Immigrants from Ghana (85.2%, a difference of 0.0%), Immigrants from Austria (85.2%, a difference of 0.010%), Alsatian (85.2%, a difference of 0.010%), Immigrants from Middle Africa (85.2%, a difference of 0.010%), and Immigrants from Northern Africa (85.2%, a difference of 0.010%).
| Demographics | Rating | Rank | In Labor Force | Age 30-34 |
| Immigrants | Korea | 97.3 /100 | #96 | Exceptional 85.2% |
| Thais | 97.2 /100 | #97 | Exceptional 85.2% |
| Immigrants | Uganda | 97.2 /100 | #98 | Exceptional 85.2% |
| Belgians | 97.2 /100 | #99 | Exceptional 85.2% |
| Sudanese | 97.1 /100 | #100 | Exceptional 85.2% |
| Immigrants | Belarus | 96.9 /100 | #101 | Exceptional 85.2% |
| Immigrants | Austria | 96.8 /100 | #102 | Exceptional 85.2% |
| Ukrainians | 96.6 /100 | #103 | Exceptional 85.2% |
| Immigrants | Ghana | 96.5 /100 | #104 | Exceptional 85.2% |
| Alsatians | 96.3 /100 | #105 | Exceptional 85.2% |
| Immigrants | Middle Africa | 96.3 /100 | #106 | Exceptional 85.2% |
| Immigrants | Northern Africa | 96.3 /100 | #107 | Exceptional 85.2% |
| Immigrants | Zimbabwe | 95.8 /100 | #108 | Exceptional 85.1% |
| Argentineans | 95.8 /100 | #109 | Exceptional 85.1% |
| Immigrants | South Africa | 95.3 /100 | #110 | Exceptional 85.1% |