Immigrants from Nepal vs Immigrants from Latin America In Labor Force | Age 30-34
COMPARE
Immigrants from Nepal
Immigrants from Latin America
In Labor Force | Age 30-34
In Labor Force | Age 30-34 Comparison
Immigrants from Nepal
Immigrants from Latin America
85.6%
IN LABOR FORCE | AGE 30-34
99.8/ 100
METRIC RATING
45th/ 347
METRIC RANK
83.1%
IN LABOR FORCE | AGE 30-34
0.0/ 100
METRIC RATING
286th/ 347
METRIC RANK
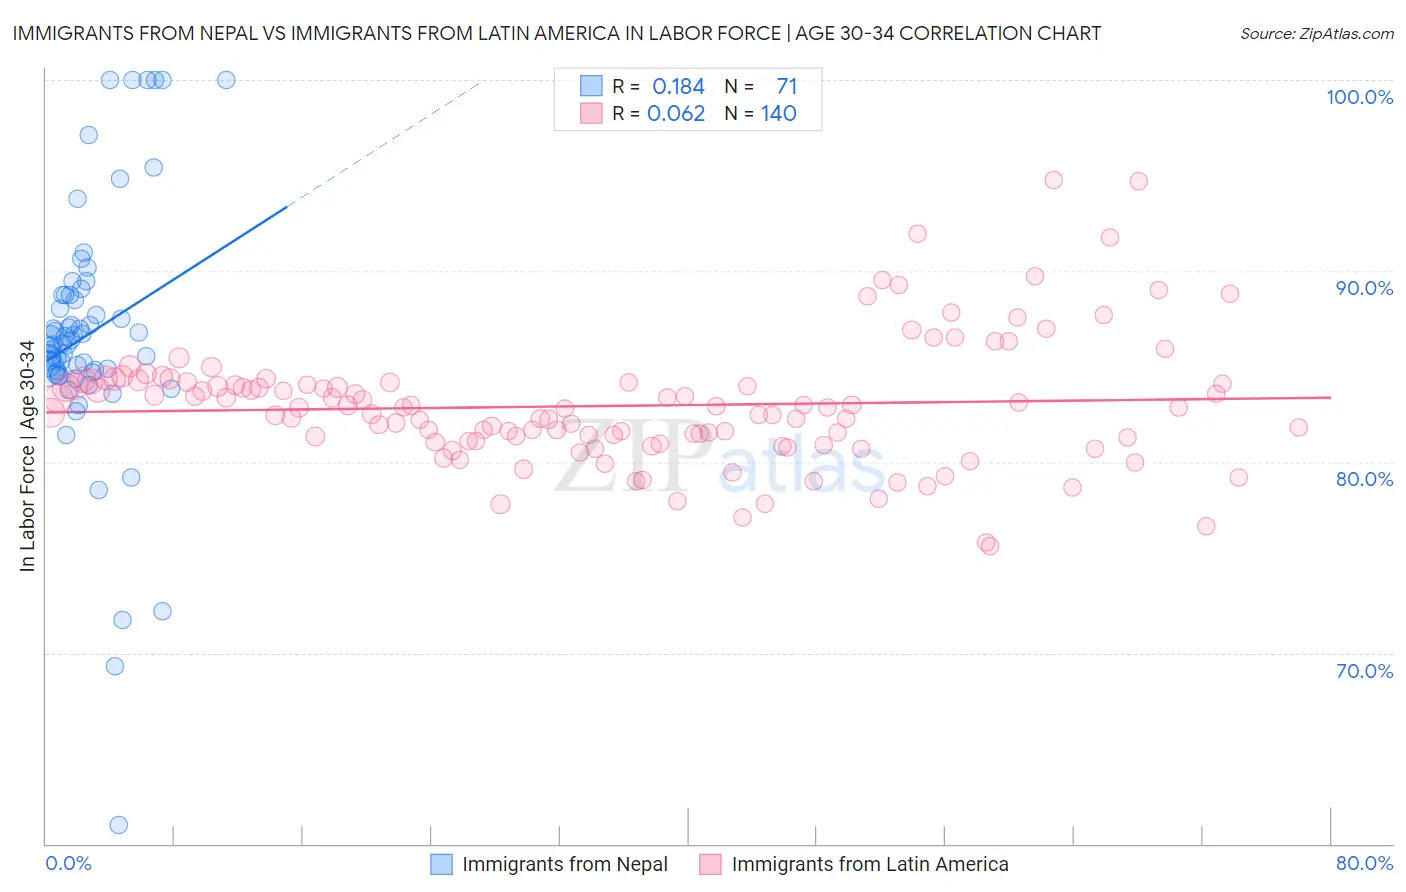
Immigrants from Nepal vs Immigrants from Latin America In Labor Force | Age 30-34 Correlation Chart
The statistical analysis conducted on geographies consisting of 186,729,132 people shows a poor positive correlation between the proportion of Immigrants from Nepal and labor force participation rate among population between the ages 30 and 34 in the United States with a correlation coefficient (R) of 0.184 and weighted average of 85.6%. Similarly, the statistical analysis conducted on geographies consisting of 557,588,072 people shows a slight positive correlation between the proportion of Immigrants from Latin America and labor force participation rate among population between the ages 30 and 34 in the United States with a correlation coefficient (R) of 0.062 and weighted average of 83.1%, a difference of 3.0%.
In Labor Force | Age 30-34 Correlation Summary
| Measurement | Immigrants from Nepal | Immigrants from Latin America |
| Minimum | 61.0% | 75.6% |
| Maximum | 100.0% | 94.8% |
| Range | 39.0% | 19.2% |
| Mean | 86.7% | 82.9% |
| Median | 86.2% | 82.8% |
| Interquartile 25% (IQ1) | 84.7% | 81.1% |
| Interquartile 75% (IQ3) | 88.7% | 84.2% |
| Interquartile Range (IQR) | 4.1% | 3.1% |
| Standard Deviation (Sample) | 6.7% | 3.2% |
| Standard Deviation (Population) | 6.6% | 3.2% |
Similar Demographics by In Labor Force | Age 30-34
Demographics Similar to Immigrants from Nepal by In Labor Force | Age 30-34
In terms of in labor force | age 30-34, the demographic groups most similar to Immigrants from Nepal are Immigrants from Sri Lanka (85.6%, a difference of 0.010%), Immigrants from Morocco (85.6%, a difference of 0.010%), Croatian (85.6%, a difference of 0.010%), Immigrants from Lithuania (85.6%, a difference of 0.030%), and Immigrants from Sweden (85.6%, a difference of 0.030%).
| Demographics | Rating | Rank | In Labor Force | Age 30-34 |
| Immigrants | Greece | 99.9 /100 | #38 | Exceptional 85.7% |
| Eastern Europeans | 99.9 /100 | #39 | Exceptional 85.7% |
| Turks | 99.9 /100 | #40 | Exceptional 85.7% |
| Immigrants | Italy | 99.9 /100 | #41 | Exceptional 85.7% |
| Zimbabweans | 99.8 /100 | #42 | Exceptional 85.6% |
| Immigrants | Lithuania | 99.8 /100 | #43 | Exceptional 85.6% |
| Immigrants | Sri Lanka | 99.8 /100 | #44 | Exceptional 85.6% |
| Immigrants | Nepal | 99.8 /100 | #45 | Exceptional 85.6% |
| Immigrants | Morocco | 99.8 /100 | #46 | Exceptional 85.6% |
| Croatians | 99.8 /100 | #47 | Exceptional 85.6% |
| Immigrants | Sweden | 99.8 /100 | #48 | Exceptional 85.6% |
| Lithuanians | 99.8 /100 | #49 | Exceptional 85.6% |
| Immigrants | Australia | 99.8 /100 | #50 | Exceptional 85.6% |
| Cape Verdeans | 99.7 /100 | #51 | Exceptional 85.6% |
| Slovenes | 99.7 /100 | #52 | Exceptional 85.6% |
Demographics Similar to Immigrants from Latin America by In Labor Force | Age 30-34
In terms of in labor force | age 30-34, the demographic groups most similar to Immigrants from Latin America are Immigrants from Belize (83.2%, a difference of 0.060%), Cree (83.2%, a difference of 0.060%), Native Hawaiian (83.0%, a difference of 0.10%), Assyrian/Chaldean/Syriac (83.2%, a difference of 0.11%), and Mexican American Indian (83.2%, a difference of 0.12%).
| Demographics | Rating | Rank | In Labor Force | Age 30-34 |
| Immigrants | Fiji | 0.0 /100 | #279 | Tragic 83.4% |
| Africans | 0.0 /100 | #280 | Tragic 83.4% |
| Samoans | 0.0 /100 | #281 | Tragic 83.3% |
| Mexican American Indians | 0.0 /100 | #282 | Tragic 83.2% |
| Assyrians/Chaldeans/Syriacs | 0.0 /100 | #283 | Tragic 83.2% |
| Immigrants | Belize | 0.0 /100 | #284 | Tragic 83.2% |
| Cree | 0.0 /100 | #285 | Tragic 83.2% |
| Immigrants | Latin America | 0.0 /100 | #286 | Tragic 83.1% |
| Native Hawaiians | 0.0 /100 | #287 | Tragic 83.0% |
| Central American Indians | 0.0 /100 | #288 | Tragic 83.0% |
| Hawaiians | 0.0 /100 | #289 | Tragic 83.0% |
| Blackfeet | 0.0 /100 | #290 | Tragic 82.8% |
| Potawatomi | 0.0 /100 | #291 | Tragic 82.8% |
| Blacks/African Americans | 0.0 /100 | #292 | Tragic 82.8% |
| Nepalese | 0.0 /100 | #293 | Tragic 82.7% |