Immigrants from Mexico vs Macedonian In Labor Force | Age 45-54
COMPARE
Immigrants from Mexico
Macedonian
In Labor Force | Age 45-54
In Labor Force | Age 45-54 Comparison
Immigrants from Mexico
Macedonians
79.7%
IN LABOR FORCE | AGE 45-54
0.0/ 100
METRIC RATING
312th/ 347
METRIC RANK
83.5%
IN LABOR FORCE | AGE 45-54
98.7/ 100
METRIC RATING
55th/ 347
METRIC RANK
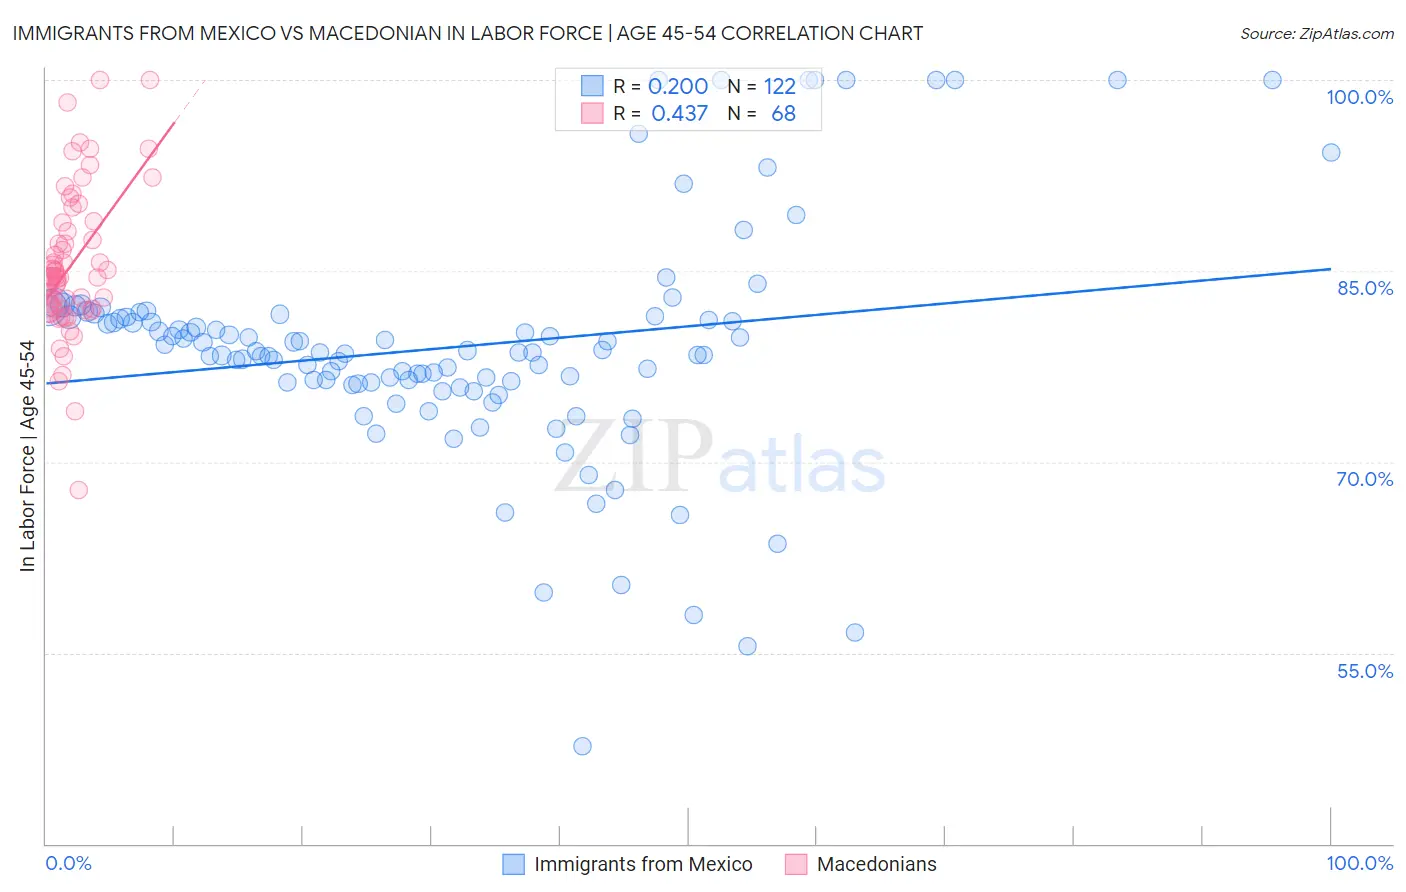
Immigrants from Mexico vs Macedonian In Labor Force | Age 45-54 Correlation Chart
The statistical analysis conducted on geographies consisting of 513,319,268 people shows a poor positive correlation between the proportion of Immigrants from Mexico and labor force participation rate among population between the ages 45 and 54 in the United States with a correlation coefficient (R) of 0.200 and weighted average of 79.7%. Similarly, the statistical analysis conducted on geographies consisting of 132,596,520 people shows a moderate positive correlation between the proportion of Macedonians and labor force participation rate among population between the ages 45 and 54 in the United States with a correlation coefficient (R) of 0.437 and weighted average of 83.5%, a difference of 4.9%.
In Labor Force | Age 45-54 Correlation Summary
| Measurement | Immigrants from Mexico | Macedonian |
| Minimum | 47.6% | 67.8% |
| Maximum | 100.0% | 100.0% |
| Range | 52.4% | 32.2% |
| Mean | 79.0% | 85.5% |
| Median | 78.6% | 84.5% |
| Interquartile 25% (IQ1) | 76.2% | 82.1% |
| Interquartile 75% (IQ3) | 81.4% | 88.5% |
| Interquartile Range (IQR) | 5.2% | 6.4% |
| Standard Deviation (Sample) | 9.1% | 5.8% |
| Standard Deviation (Population) | 9.1% | 5.7% |
Similar Demographics by In Labor Force | Age 45-54
Demographics Similar to Immigrants from Mexico by In Labor Force | Age 45-54
In terms of in labor force | age 45-54, the demographic groups most similar to Immigrants from Mexico are Mexican (79.8%, a difference of 0.14%), Colville (79.5%, a difference of 0.24%), Inupiat (79.9%, a difference of 0.25%), Ottawa (79.5%, a difference of 0.28%), and Potawatomi (80.0%, a difference of 0.34%).
| Demographics | Rating | Rank | In Labor Force | Age 45-54 |
| Immigrants | Dominican Republic | 0.0 /100 | #305 | Tragic 80.1% |
| Spanish Americans | 0.0 /100 | #306 | Tragic 80.1% |
| Blackfeet | 0.0 /100 | #307 | Tragic 80.0% |
| Central American Indians | 0.0 /100 | #308 | Tragic 80.0% |
| Potawatomi | 0.0 /100 | #309 | Tragic 80.0% |
| Inupiat | 0.0 /100 | #310 | Tragic 79.9% |
| Mexicans | 0.0 /100 | #311 | Tragic 79.8% |
| Immigrants | Mexico | 0.0 /100 | #312 | Tragic 79.7% |
| Colville | 0.0 /100 | #313 | Tragic 79.5% |
| Ottawa | 0.0 /100 | #314 | Tragic 79.5% |
| Blacks/African Americans | 0.0 /100 | #315 | Tragic 79.3% |
| Shoshone | 0.0 /100 | #316 | Tragic 79.3% |
| Comanche | 0.0 /100 | #317 | Tragic 79.2% |
| Chickasaw | 0.0 /100 | #318 | Tragic 79.0% |
| Cherokee | 0.0 /100 | #319 | Tragic 79.0% |
Demographics Similar to Macedonians by In Labor Force | Age 45-54
In terms of in labor force | age 45-54, the demographic groups most similar to Macedonians are Somali (83.5%, a difference of 0.010%), Immigrants from Greece (83.6%, a difference of 0.020%), Immigrants from Turkey (83.6%, a difference of 0.020%), Polish (83.6%, a difference of 0.020%), and Peruvian (83.6%, a difference of 0.020%).
| Demographics | Rating | Rank | In Labor Force | Age 45-54 |
| Immigrants | Poland | 99.0 /100 | #48 | Exceptional 83.6% |
| Immigrants | Morocco | 99.0 /100 | #49 | Exceptional 83.6% |
| Immigrants | Greece | 98.8 /100 | #50 | Exceptional 83.6% |
| Immigrants | Turkey | 98.8 /100 | #51 | Exceptional 83.6% |
| Poles | 98.7 /100 | #52 | Exceptional 83.6% |
| Peruvians | 98.7 /100 | #53 | Exceptional 83.6% |
| Somalis | 98.7 /100 | #54 | Exceptional 83.5% |
| Macedonians | 98.7 /100 | #55 | Exceptional 83.5% |
| Immigrants | Peru | 98.6 /100 | #56 | Exceptional 83.5% |
| Paraguayans | 98.5 /100 | #57 | Exceptional 83.5% |
| Eastern Europeans | 98.5 /100 | #58 | Exceptional 83.5% |
| Bhutanese | 98.3 /100 | #59 | Exceptional 83.5% |
| Carpatho Rusyns | 98.3 /100 | #60 | Exceptional 83.5% |
| Filipinos | 98.3 /100 | #61 | Exceptional 83.5% |
| Immigrants | Taiwan | 98.0 /100 | #62 | Exceptional 83.5% |