Immigrants from Malaysia vs Alsatian In Labor Force | Age 16-19
COMPARE
Immigrants from Malaysia
Alsatian
In Labor Force | Age 16-19
In Labor Force | Age 16-19 Comparison
Immigrants from Malaysia
Alsatians
34.3%
IN LABOR FORCE | AGE 16-19
0.7/ 100
METRIC RATING
266th/ 347
METRIC RANK
35.9%
IN LABOR FORCE | AGE 16-19
17.5/ 100
METRIC RATING
201st/ 347
METRIC RANK
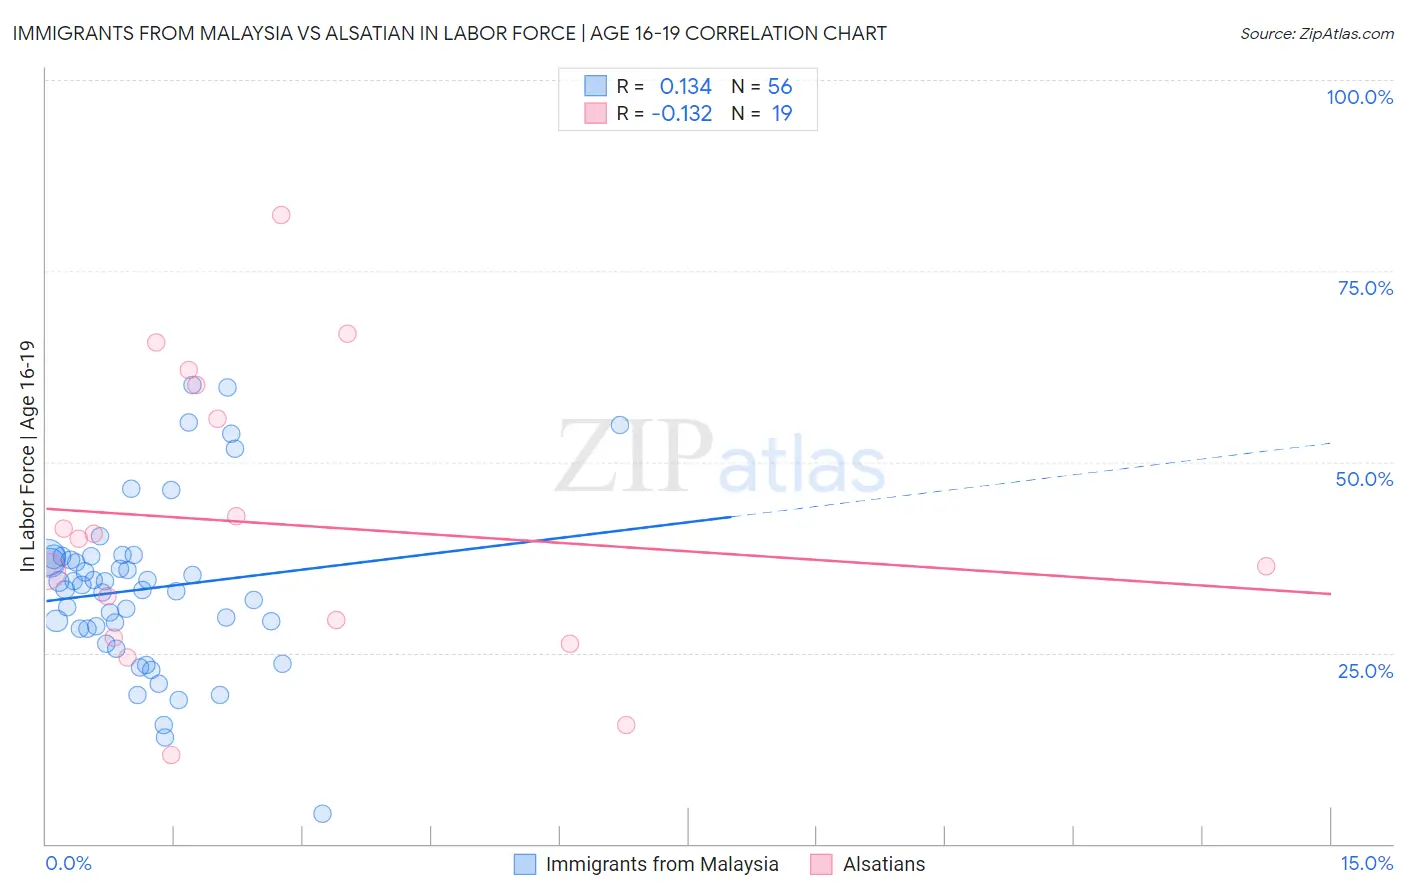
Immigrants from Malaysia vs Alsatian In Labor Force | Age 16-19 Correlation Chart
The statistical analysis conducted on geographies consisting of 197,895,635 people shows a poor positive correlation between the proportion of Immigrants from Malaysia and labor force participation rate among population between the ages 16 and 19 in the United States with a correlation coefficient (R) of 0.134 and weighted average of 34.3%. Similarly, the statistical analysis conducted on geographies consisting of 82,608,203 people shows a poor negative correlation between the proportion of Alsatians and labor force participation rate among population between the ages 16 and 19 in the United States with a correlation coefficient (R) of -0.132 and weighted average of 35.9%, a difference of 4.6%.
In Labor Force | Age 16-19 Correlation Summary
| Measurement | Immigrants from Malaysia | Alsatian |
| Minimum | 4.0% | 11.6% |
| Maximum | 60.1% | 82.4% |
| Range | 56.1% | 70.8% |
| Mean | 33.4% | 41.9% |
| Median | 33.6% | 40.0% |
| Interquartile 25% (IQ1) | 28.1% | 27.0% |
| Interquartile 75% (IQ3) | 37.5% | 60.0% |
| Interquartile Range (IQR) | 9.4% | 33.0% |
| Standard Deviation (Sample) | 11.0% | 18.9% |
| Standard Deviation (Population) | 10.9% | 18.4% |
Similar Demographics by In Labor Force | Age 16-19
Demographics Similar to Immigrants from Malaysia by In Labor Force | Age 16-19
In terms of in labor force | age 16-19, the demographic groups most similar to Immigrants from Malaysia are Immigrants from El Salvador (34.3%, a difference of 0.090%), Immigrants from Uruguay (34.4%, a difference of 0.33%), Immigrants from Peru (34.2%, a difference of 0.36%), Immigrants from Asia (34.1%, a difference of 0.48%), and Pima (34.1%, a difference of 0.56%).
| Demographics | Rating | Rank | In Labor Force | Age 16-19 |
| Immigrants | Immigrants | 1.2 /100 | #259 | Tragic 34.6% |
| Egyptians | 1.2 /100 | #260 | Tragic 34.5% |
| Salvadorans | 1.1 /100 | #261 | Tragic 34.5% |
| Hispanics or Latinos | 1.1 /100 | #262 | Tragic 34.5% |
| Burmese | 1.1 /100 | #263 | Tragic 34.5% |
| Immigrants | Uruguay | 0.9 /100 | #264 | Tragic 34.4% |
| Immigrants | El Salvador | 0.7 /100 | #265 | Tragic 34.3% |
| Immigrants | Malaysia | 0.7 /100 | #266 | Tragic 34.3% |
| Immigrants | Peru | 0.5 /100 | #267 | Tragic 34.2% |
| Immigrants | Asia | 0.5 /100 | #268 | Tragic 34.1% |
| Pima | 0.5 /100 | #269 | Tragic 34.1% |
| Immigrants | Russia | 0.4 /100 | #270 | Tragic 34.1% |
| Central American Indians | 0.4 /100 | #271 | Tragic 34.1% |
| Asians | 0.4 /100 | #272 | Tragic 34.1% |
| Immigrants | Panama | 0.4 /100 | #273 | Tragic 34.0% |
Demographics Similar to Alsatians by In Labor Force | Age 16-19
In terms of in labor force | age 16-19, the demographic groups most similar to Alsatians are Senegalese (35.9%, a difference of 0.010%), Immigrants from Nigeria (35.8%, a difference of 0.070%), Immigrants from Sweden (35.9%, a difference of 0.12%), Immigrants from Norway (35.9%, a difference of 0.19%), and Immigrants from Northern Africa (35.9%, a difference of 0.21%).
| Demographics | Rating | Rank | In Labor Force | Age 16-19 |
| Nigerians | 24.6 /100 | #194 | Fair 36.1% |
| Bolivians | 23.3 /100 | #195 | Fair 36.0% |
| Mexican American Indians | 21.1 /100 | #196 | Fair 36.0% |
| Immigrants | Serbia | 21.0 /100 | #197 | Fair 36.0% |
| Immigrants | Northern Africa | 19.9 /100 | #198 | Poor 35.9% |
| Immigrants | Norway | 19.8 /100 | #199 | Poor 35.9% |
| Immigrants | Sweden | 18.8 /100 | #200 | Poor 35.9% |
| Alsatians | 17.5 /100 | #201 | Poor 35.9% |
| Senegalese | 17.4 /100 | #202 | Poor 35.9% |
| Immigrants | Nigeria | 16.8 /100 | #203 | Poor 35.8% |
| Immigrants | Albania | 15.0 /100 | #204 | Poor 35.8% |
| South American Indians | 14.6 /100 | #205 | Poor 35.8% |
| Chileans | 14.6 /100 | #206 | Poor 35.8% |
| Immigrants | Eastern Europe | 14.5 /100 | #207 | Poor 35.8% |
| Koreans | 13.3 /100 | #208 | Poor 35.7% |