Somali vs Alsatian In Labor Force | Age 16-19
COMPARE
Somali
Alsatian
In Labor Force | Age 16-19
In Labor Force | Age 16-19 Comparison
Somalis
Alsatians
45.1%
IN LABOR FORCE | AGE 16-19
100.0/ 100
METRIC RATING
6th/ 347
METRIC RANK
35.9%
IN LABOR FORCE | AGE 16-19
17.5/ 100
METRIC RATING
201st/ 347
METRIC RANK
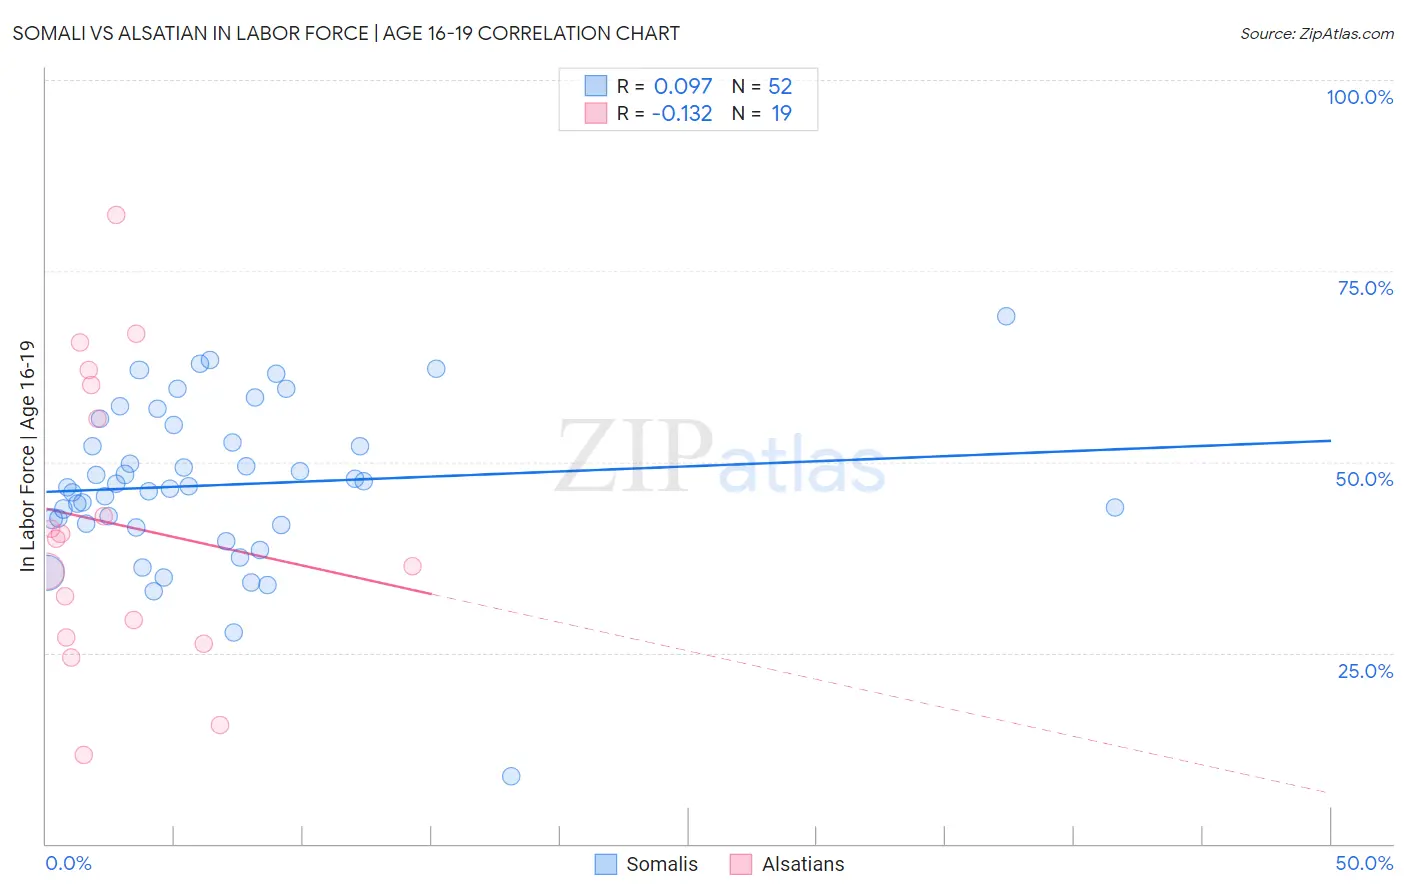
Somali vs Alsatian In Labor Force | Age 16-19 Correlation Chart
The statistical analysis conducted on geographies consisting of 99,321,007 people shows a slight positive correlation between the proportion of Somalis and labor force participation rate among population between the ages 16 and 19 in the United States with a correlation coefficient (R) of 0.097 and weighted average of 45.1%. Similarly, the statistical analysis conducted on geographies consisting of 82,608,203 people shows a poor negative correlation between the proportion of Alsatians and labor force participation rate among population between the ages 16 and 19 in the United States with a correlation coefficient (R) of -0.132 and weighted average of 35.9%, a difference of 25.9%.
In Labor Force | Age 16-19 Correlation Summary
| Measurement | Somali | Alsatian |
| Minimum | 8.8% | 11.6% |
| Maximum | 69.1% | 82.4% |
| Range | 60.3% | 70.8% |
| Mean | 47.0% | 41.9% |
| Median | 46.7% | 40.0% |
| Interquartile 25% (IQ1) | 41.8% | 27.0% |
| Interquartile 75% (IQ3) | 53.7% | 60.0% |
| Interquartile Range (IQR) | 11.8% | 33.0% |
| Standard Deviation (Sample) | 10.6% | 18.9% |
| Standard Deviation (Population) | 10.5% | 18.4% |
Similar Demographics by In Labor Force | Age 16-19
Demographics Similar to Somalis by In Labor Force | Age 16-19
In terms of in labor force | age 16-19, the demographic groups most similar to Somalis are Alaskan Athabascan (45.2%, a difference of 0.17%), Luxembourger (45.3%, a difference of 0.36%), Danish (44.7%, a difference of 0.95%), Immigrants from Cabo Verde (44.7%, a difference of 0.99%), and Immigrants from Somalia (45.6%, a difference of 1.0%).
| Demographics | Rating | Rank | In Labor Force | Age 16-19 |
| Pennsylvania Germans | 100.0 /100 | #1 | Exceptional 46.4% |
| Norwegians | 100.0 /100 | #2 | Exceptional 46.2% |
| Immigrants | Somalia | 100.0 /100 | #3 | Exceptional 45.6% |
| Luxembourgers | 100.0 /100 | #4 | Exceptional 45.3% |
| Alaskan Athabascans | 100.0 /100 | #5 | Exceptional 45.2% |
| Somalis | 100.0 /100 | #6 | Exceptional 45.1% |
| Danes | 100.0 /100 | #7 | Exceptional 44.7% |
| Immigrants | Cabo Verde | 100.0 /100 | #8 | Exceptional 44.7% |
| Cape Verdeans | 100.0 /100 | #9 | Exceptional 44.5% |
| Germans | 100.0 /100 | #10 | Exceptional 44.2% |
| Swedes | 100.0 /100 | #11 | Exceptional 44.1% |
| Finns | 100.0 /100 | #12 | Exceptional 43.9% |
| Dutch | 100.0 /100 | #13 | Exceptional 43.8% |
| Chippewa | 100.0 /100 | #14 | Exceptional 43.8% |
| Slovenes | 100.0 /100 | #15 | Exceptional 43.7% |
Demographics Similar to Alsatians by In Labor Force | Age 16-19
In terms of in labor force | age 16-19, the demographic groups most similar to Alsatians are Senegalese (35.9%, a difference of 0.010%), Immigrants from Nigeria (35.8%, a difference of 0.070%), Immigrants from Sweden (35.9%, a difference of 0.12%), Immigrants from Norway (35.9%, a difference of 0.19%), and Immigrants from Northern Africa (35.9%, a difference of 0.21%).
| Demographics | Rating | Rank | In Labor Force | Age 16-19 |
| Nigerians | 24.6 /100 | #194 | Fair 36.1% |
| Bolivians | 23.3 /100 | #195 | Fair 36.0% |
| Mexican American Indians | 21.1 /100 | #196 | Fair 36.0% |
| Immigrants | Serbia | 21.0 /100 | #197 | Fair 36.0% |
| Immigrants | Northern Africa | 19.9 /100 | #198 | Poor 35.9% |
| Immigrants | Norway | 19.8 /100 | #199 | Poor 35.9% |
| Immigrants | Sweden | 18.8 /100 | #200 | Poor 35.9% |
| Alsatians | 17.5 /100 | #201 | Poor 35.9% |
| Senegalese | 17.4 /100 | #202 | Poor 35.9% |
| Immigrants | Nigeria | 16.8 /100 | #203 | Poor 35.8% |
| Immigrants | Albania | 15.0 /100 | #204 | Poor 35.8% |
| South American Indians | 14.6 /100 | #205 | Poor 35.8% |
| Chileans | 14.6 /100 | #206 | Poor 35.8% |
| Immigrants | Eastern Europe | 14.5 /100 | #207 | Poor 35.8% |
| Koreans | 13.3 /100 | #208 | Poor 35.7% |