Immigrants from Eastern Africa vs Alsatian In Labor Force | Age 16-19
COMPARE
Immigrants from Eastern Africa
Alsatian
In Labor Force | Age 16-19
In Labor Force | Age 16-19 Comparison
Immigrants from Eastern Africa
Alsatians
40.4%
IN LABOR FORCE | AGE 16-19
100.0/ 100
METRIC RATING
60th/ 347
METRIC RANK
35.9%
IN LABOR FORCE | AGE 16-19
17.5/ 100
METRIC RATING
201st/ 347
METRIC RANK
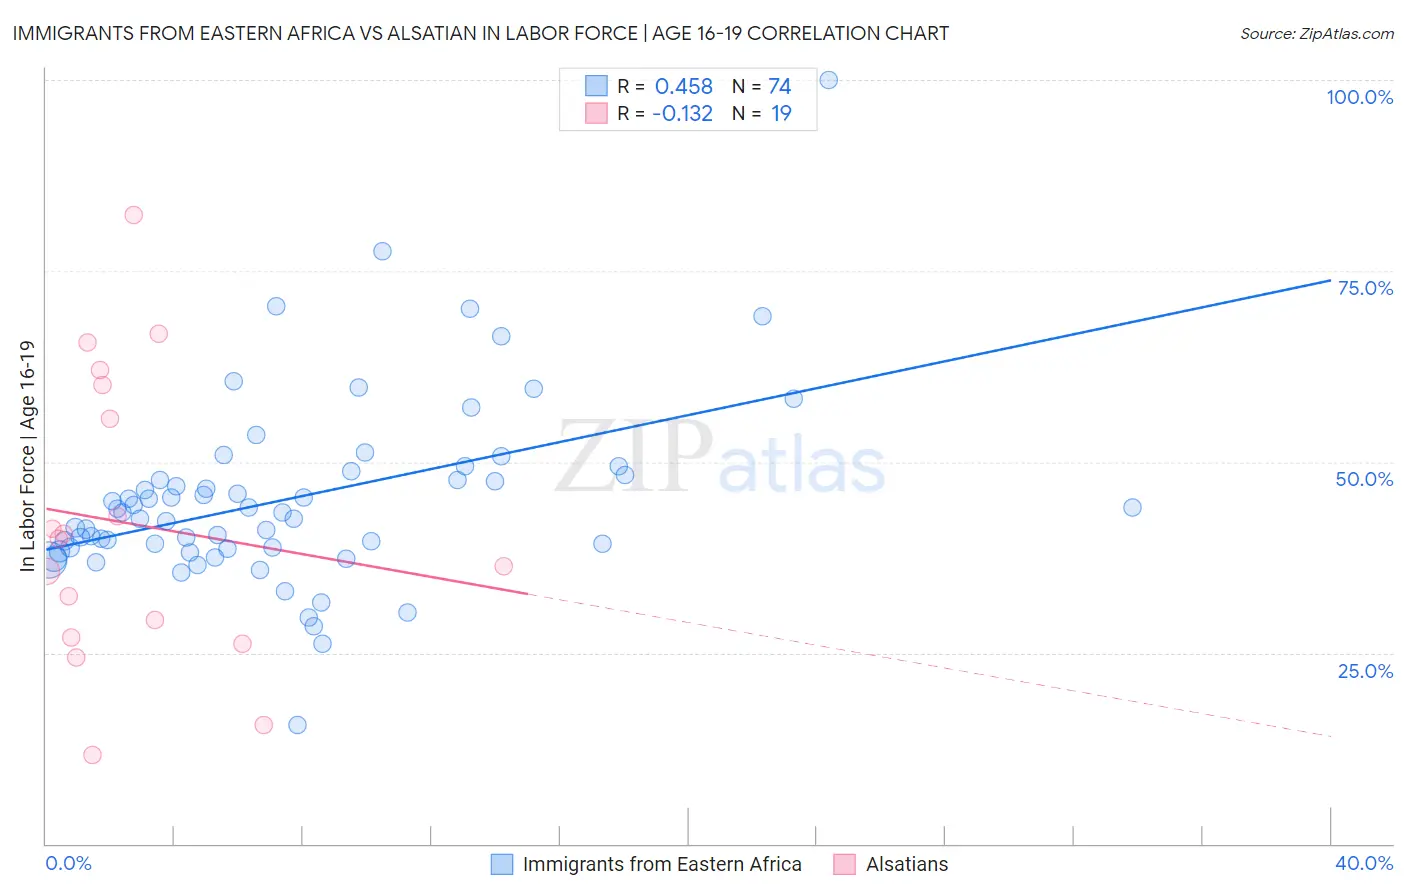
Immigrants from Eastern Africa vs Alsatian In Labor Force | Age 16-19 Correlation Chart
The statistical analysis conducted on geographies consisting of 354,925,965 people shows a moderate positive correlation between the proportion of Immigrants from Eastern Africa and labor force participation rate among population between the ages 16 and 19 in the United States with a correlation coefficient (R) of 0.458 and weighted average of 40.4%. Similarly, the statistical analysis conducted on geographies consisting of 82,608,203 people shows a poor negative correlation between the proportion of Alsatians and labor force participation rate among population between the ages 16 and 19 in the United States with a correlation coefficient (R) of -0.132 and weighted average of 35.9%, a difference of 12.6%.
In Labor Force | Age 16-19 Correlation Summary
| Measurement | Immigrants from Eastern Africa | Alsatian |
| Minimum | 15.6% | 11.6% |
| Maximum | 100.0% | 82.4% |
| Range | 84.4% | 70.8% |
| Mean | 45.2% | 41.9% |
| Median | 43.4% | 40.0% |
| Interquartile 25% (IQ1) | 38.8% | 27.0% |
| Interquartile 75% (IQ3) | 48.2% | 60.0% |
| Interquartile Range (IQR) | 9.4% | 33.0% |
| Standard Deviation (Sample) | 12.3% | 18.9% |
| Standard Deviation (Population) | 12.2% | 18.4% |
Similar Demographics by In Labor Force | Age 16-19
Demographics Similar to Immigrants from Eastern Africa by In Labor Force | Age 16-19
In terms of in labor force | age 16-19, the demographic groups most similar to Immigrants from Eastern Africa are Slavic (40.4%, a difference of 0.040%), American (40.3%, a difference of 0.15%), Aleut (40.4%, a difference of 0.18%), Lithuanian (40.4%, a difference of 0.19%), and Fijian (40.4%, a difference of 0.22%).
| Demographics | Rating | Rank | In Labor Force | Age 16-19 |
| Immigrants | Kenya | 100.0 /100 | #53 | Exceptional 40.5% |
| Tlingit-Haida | 100.0 /100 | #54 | Exceptional 40.5% |
| British | 100.0 /100 | #55 | Exceptional 40.5% |
| Fijians | 100.0 /100 | #56 | Exceptional 40.4% |
| Lithuanians | 100.0 /100 | #57 | Exceptional 40.4% |
| Aleuts | 100.0 /100 | #58 | Exceptional 40.4% |
| Slavs | 100.0 /100 | #59 | Exceptional 40.4% |
| Immigrants | Eastern Africa | 100.0 /100 | #60 | Exceptional 40.4% |
| Americans | 100.0 /100 | #61 | Exceptional 40.3% |
| Cherokee | 100.0 /100 | #62 | Exceptional 40.2% |
| Northern Europeans | 100.0 /100 | #63 | Exceptional 40.2% |
| Immigrants | Micronesia | 100.0 /100 | #64 | Exceptional 40.2% |
| Kenyans | 100.0 /100 | #65 | Exceptional 40.1% |
| Immigrants | Nonimmigrants | 100.0 /100 | #66 | Exceptional 40.1% |
| Canadians | 100.0 /100 | #67 | Exceptional 40.1% |
Demographics Similar to Alsatians by In Labor Force | Age 16-19
In terms of in labor force | age 16-19, the demographic groups most similar to Alsatians are Senegalese (35.9%, a difference of 0.010%), Immigrants from Nigeria (35.8%, a difference of 0.070%), Immigrants from Sweden (35.9%, a difference of 0.12%), Immigrants from Norway (35.9%, a difference of 0.19%), and Immigrants from Northern Africa (35.9%, a difference of 0.21%).
| Demographics | Rating | Rank | In Labor Force | Age 16-19 |
| Nigerians | 24.6 /100 | #194 | Fair 36.1% |
| Bolivians | 23.3 /100 | #195 | Fair 36.0% |
| Mexican American Indians | 21.1 /100 | #196 | Fair 36.0% |
| Immigrants | Serbia | 21.0 /100 | #197 | Fair 36.0% |
| Immigrants | Northern Africa | 19.9 /100 | #198 | Poor 35.9% |
| Immigrants | Norway | 19.8 /100 | #199 | Poor 35.9% |
| Immigrants | Sweden | 18.8 /100 | #200 | Poor 35.9% |
| Alsatians | 17.5 /100 | #201 | Poor 35.9% |
| Senegalese | 17.4 /100 | #202 | Poor 35.9% |
| Immigrants | Nigeria | 16.8 /100 | #203 | Poor 35.8% |
| Immigrants | Albania | 15.0 /100 | #204 | Poor 35.8% |
| South American Indians | 14.6 /100 | #205 | Poor 35.8% |
| Chileans | 14.6 /100 | #206 | Poor 35.8% |
| Immigrants | Eastern Europe | 14.5 /100 | #207 | Poor 35.8% |
| Koreans | 13.3 /100 | #208 | Poor 35.7% |