Immigrants from Lithuania vs Immigrants from Costa Rica In Labor Force | Age 20-24
COMPARE
Immigrants from Lithuania
Immigrants from Costa Rica
In Labor Force | Age 20-24
In Labor Force | Age 20-24 Comparison
Immigrants from Lithuania
Immigrants from Costa Rica
76.1%
IN LABOR FORCE | AGE 20-24
98.0/ 100
METRIC RATING
97th/ 347
METRIC RANK
74.9%
IN LABOR FORCE | AGE 20-24
36.7/ 100
METRIC RATING
183rd/ 347
METRIC RANK
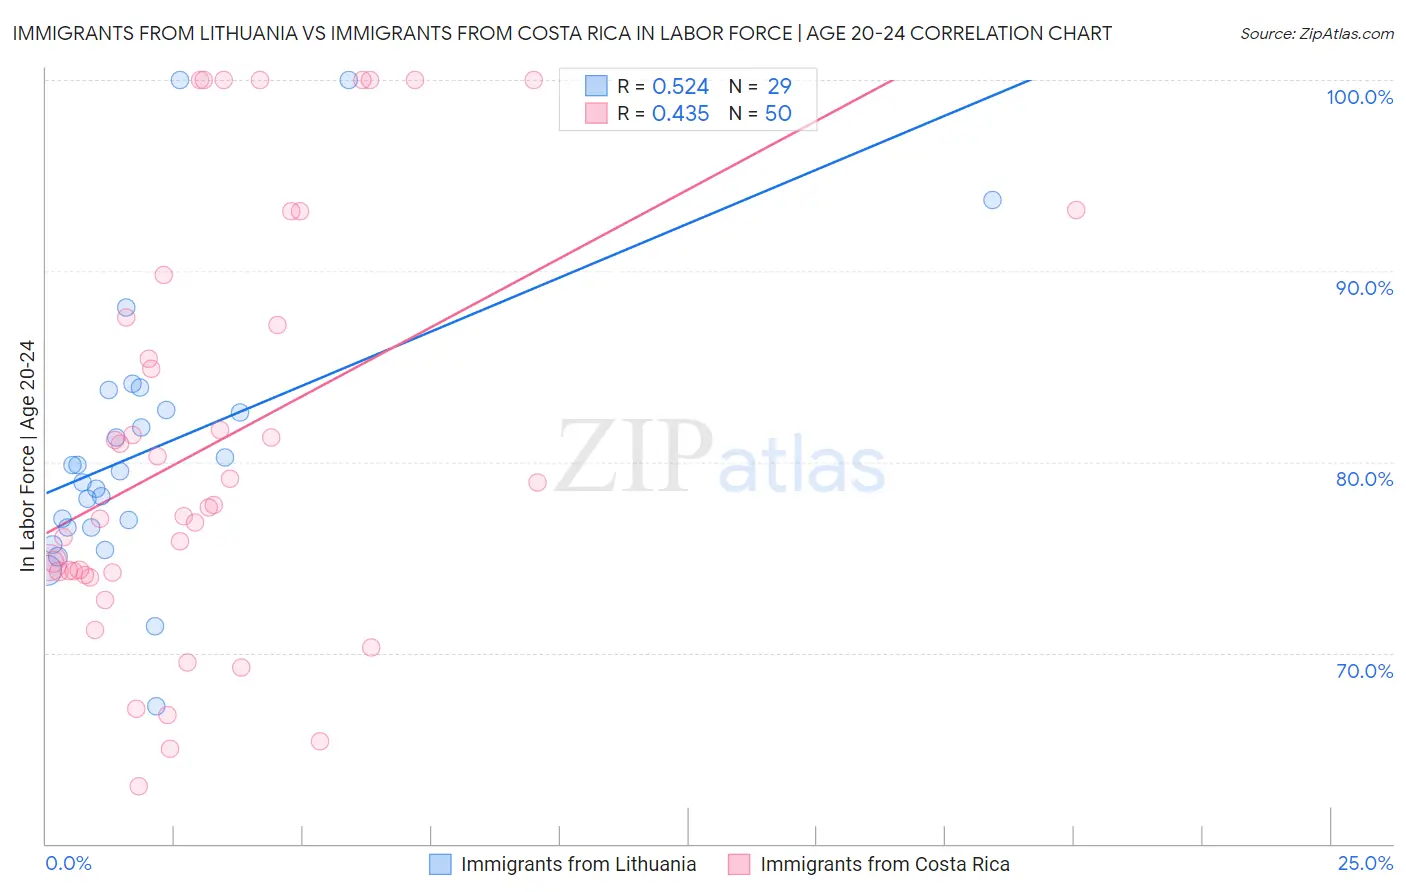
Immigrants from Lithuania vs Immigrants from Costa Rica In Labor Force | Age 20-24 Correlation Chart
The statistical analysis conducted on geographies consisting of 117,715,307 people shows a substantial positive correlation between the proportion of Immigrants from Lithuania and labor force participation rate among population between the ages 20 and 24 in the United States with a correlation coefficient (R) of 0.524 and weighted average of 76.1%. Similarly, the statistical analysis conducted on geographies consisting of 204,265,207 people shows a moderate positive correlation between the proportion of Immigrants from Costa Rica and labor force participation rate among population between the ages 20 and 24 in the United States with a correlation coefficient (R) of 0.435 and weighted average of 74.9%, a difference of 1.6%.
In Labor Force | Age 20-24 Correlation Summary
| Measurement | Immigrants from Lithuania | Immigrants from Costa Rica |
| Minimum | 67.2% | 63.0% |
| Maximum | 100.0% | 100.0% |
| Range | 32.8% | 37.0% |
| Mean | 80.7% | 80.9% |
| Median | 79.5% | 77.7% |
| Interquartile 25% (IQ1) | 76.6% | 74.2% |
| Interquartile 75% (IQ3) | 83.2% | 87.6% |
| Interquartile Range (IQR) | 6.7% | 13.4% |
| Standard Deviation (Sample) | 7.3% | 10.9% |
| Standard Deviation (Population) | 7.2% | 10.8% |
Similar Demographics by In Labor Force | Age 20-24
Demographics Similar to Immigrants from Lithuania by In Labor Force | Age 20-24
In terms of in labor force | age 20-24, the demographic groups most similar to Immigrants from Lithuania are Immigrants from Oceania (76.1%, a difference of 0.0%), American (76.1%, a difference of 0.030%), Shoshone (76.1%, a difference of 0.040%), Immigrants from Poland (76.1%, a difference of 0.050%), and Latvian (76.1%, a difference of 0.060%).
| Demographics | Rating | Rank | In Labor Force | Age 20-24 |
| Immigrants | Burma/Myanmar | 99.1 /100 | #90 | Exceptional 76.3% |
| Sierra Leoneans | 99.0 /100 | #91 | Exceptional 76.3% |
| Maltese | 98.9 /100 | #92 | Exceptional 76.3% |
| Hungarians | 98.9 /100 | #93 | Exceptional 76.3% |
| Potawatomi | 98.5 /100 | #94 | Exceptional 76.2% |
| Immigrants | Germany | 98.5 /100 | #95 | Exceptional 76.2% |
| Immigrants | Nonimmigrants | 98.5 /100 | #96 | Exceptional 76.2% |
| Immigrants | Lithuania | 98.0 /100 | #97 | Exceptional 76.1% |
| Immigrants | Oceania | 98.0 /100 | #98 | Exceptional 76.1% |
| Americans | 97.8 /100 | #99 | Exceptional 76.1% |
| Shoshone | 97.8 /100 | #100 | Exceptional 76.1% |
| Immigrants | Poland | 97.7 /100 | #101 | Exceptional 76.1% |
| Latvians | 97.6 /100 | #102 | Exceptional 76.1% |
| Immigrants | North Macedonia | 97.5 /100 | #103 | Exceptional 76.1% |
| Macedonians | 97.2 /100 | #104 | Exceptional 76.0% |
Demographics Similar to Immigrants from Costa Rica by In Labor Force | Age 20-24
In terms of in labor force | age 20-24, the demographic groups most similar to Immigrants from Costa Rica are Immigrants from South Africa (74.9%, a difference of 0.0%), Immigrants from Hungary (74.9%, a difference of 0.030%), Sri Lankan (74.9%, a difference of 0.030%), Immigrants from Eastern Europe (74.9%, a difference of 0.050%), and Immigrants from Honduras (74.9%, a difference of 0.050%).
| Demographics | Rating | Rank | In Labor Force | Age 20-24 |
| Central Americans | 48.7 /100 | #176 | Average 75.0% |
| Immigrants | Mexico | 47.8 /100 | #177 | Average 75.0% |
| Immigrants | Central America | 45.0 /100 | #178 | Average 75.0% |
| Immigrants | Latvia | 44.1 /100 | #179 | Average 75.0% |
| Immigrants | Czechoslovakia | 44.0 /100 | #180 | Average 75.0% |
| Africans | 42.5 /100 | #181 | Average 75.0% |
| Immigrants | South Africa | 36.9 /100 | #182 | Fair 74.9% |
| Immigrants | Costa Rica | 36.7 /100 | #183 | Fair 74.9% |
| Immigrants | Hungary | 35.0 /100 | #184 | Fair 74.9% |
| Sri Lankans | 34.9 /100 | #185 | Fair 74.9% |
| Immigrants | Eastern Europe | 33.8 /100 | #186 | Fair 74.9% |
| Immigrants | Honduras | 33.5 /100 | #187 | Fair 74.9% |
| Hondurans | 32.7 /100 | #188 | Fair 74.8% |
| Immigrants | Northern Europe | 32.6 /100 | #189 | Fair 74.8% |
| Russians | 32.2 /100 | #190 | Fair 74.8% |