Immigrants from Denmark vs Hispanic or Latino In Labor Force | Age 30-34
COMPARE
Immigrants from Denmark
Hispanic or Latino
In Labor Force | Age 30-34
In Labor Force | Age 30-34 Comparison
Immigrants from Denmark
Hispanics or Latinos
85.1%
IN LABOR FORCE | AGE 30-34
94.3/ 100
METRIC RATING
117th/ 347
METRIC RANK
82.4%
IN LABOR FORCE | AGE 30-34
0.0/ 100
METRIC RATING
301st/ 347
METRIC RANK
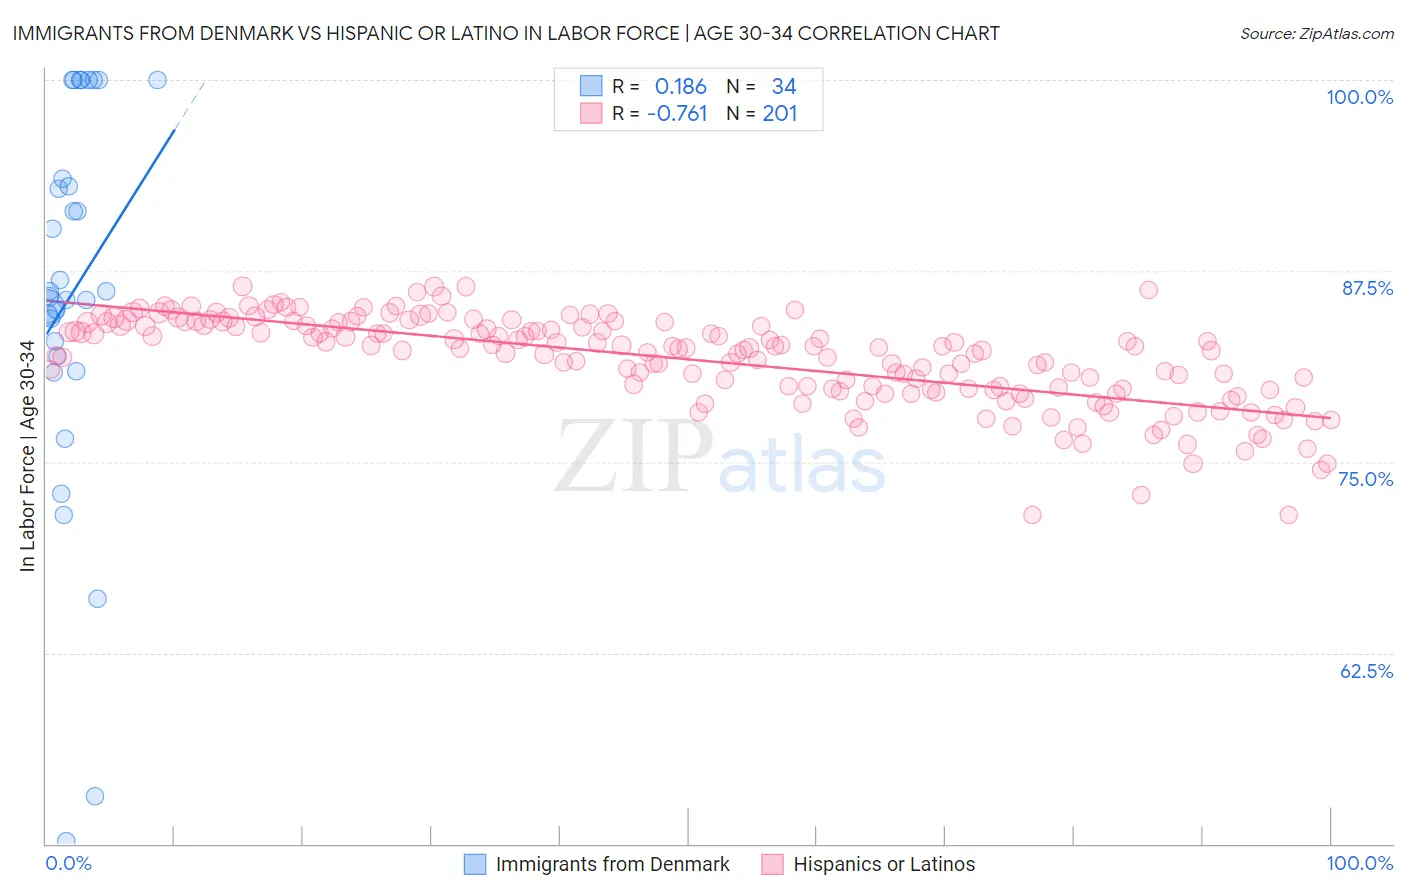
Immigrants from Denmark vs Hispanic or Latino In Labor Force | Age 30-34 Correlation Chart
The statistical analysis conducted on geographies consisting of 136,406,477 people shows a poor positive correlation between the proportion of Immigrants from Denmark and labor force participation rate among population between the ages 30 and 34 in the United States with a correlation coefficient (R) of 0.186 and weighted average of 85.1%. Similarly, the statistical analysis conducted on geographies consisting of 576,977,639 people shows a strong negative correlation between the proportion of Hispanics or Latinos and labor force participation rate among population between the ages 30 and 34 in the United States with a correlation coefficient (R) of -0.761 and weighted average of 82.4%, a difference of 3.3%.
In Labor Force | Age 30-34 Correlation Summary
| Measurement | Immigrants from Denmark | Hispanic or Latino |
| Minimum | 50.2% | 71.5% |
| Maximum | 100.0% | 86.5% |
| Range | 49.8% | 15.0% |
| Mean | 86.0% | 81.7% |
| Median | 86.0% | 82.4% |
| Interquartile 25% (IQ1) | 81.9% | 79.8% |
| Interquartile 75% (IQ3) | 93.5% | 84.0% |
| Interquartile Range (IQR) | 11.6% | 4.3% |
| Standard Deviation (Sample) | 12.5% | 2.9% |
| Standard Deviation (Population) | 12.3% | 2.9% |
Similar Demographics by In Labor Force | Age 30-34
Demographics Similar to Immigrants from Denmark by In Labor Force | Age 30-34
In terms of in labor force | age 30-34, the demographic groups most similar to Immigrants from Denmark are Immigrants from Malaysia (85.1%, a difference of 0.0%), Immigrants from Romania (85.1%, a difference of 0.010%), Yugoslavian (85.1%, a difference of 0.010%), Immigrants from South Central Asia (85.1%, a difference of 0.010%), and Egyptian (85.1%, a difference of 0.010%).
| Demographics | Rating | Rank | In Labor Force | Age 30-34 |
| Immigrants | South Africa | 95.3 /100 | #110 | Exceptional 85.1% |
| Immigrants | Scotland | 94.9 /100 | #111 | Exceptional 85.1% |
| Immigrants | Hungary | 94.8 /100 | #112 | Exceptional 85.1% |
| Immigrants | Romania | 94.7 /100 | #113 | Exceptional 85.1% |
| Yugoslavians | 94.7 /100 | #114 | Exceptional 85.1% |
| Immigrants | South Central Asia | 94.6 /100 | #115 | Exceptional 85.1% |
| Egyptians | 94.5 /100 | #116 | Exceptional 85.1% |
| Immigrants | Denmark | 94.3 /100 | #117 | Exceptional 85.1% |
| Immigrants | Malaysia | 94.2 /100 | #118 | Exceptional 85.1% |
| Asians | 93.4 /100 | #119 | Exceptional 85.1% |
| Immigrants | Southern Europe | 93.3 /100 | #120 | Exceptional 85.1% |
| Immigrants | Egypt | 93.2 /100 | #121 | Exceptional 85.1% |
| Immigrants | Kuwait | 92.6 /100 | #122 | Exceptional 85.1% |
| Armenians | 92.2 /100 | #123 | Exceptional 85.0% |
| Australians | 92.0 /100 | #124 | Exceptional 85.0% |
Demographics Similar to Hispanics or Latinos by In Labor Force | Age 30-34
In terms of in labor force | age 30-34, the demographic groups most similar to Hispanics or Latinos are Hmong (82.4%, a difference of 0.010%), Ottawa (82.4%, a difference of 0.030%), Immigrants from Micronesia (82.4%, a difference of 0.040%), Immigrants from Central America (82.5%, a difference of 0.070%), and Tlingit-Haida (82.3%, a difference of 0.12%).
| Demographics | Rating | Rank | In Labor Force | Age 30-34 |
| Americans | 0.0 /100 | #294 | Tragic 82.7% |
| Pennsylvania Germans | 0.0 /100 | #295 | Tragic 82.6% |
| Chippewa | 0.0 /100 | #296 | Tragic 82.6% |
| Comanche | 0.0 /100 | #297 | Tragic 82.6% |
| Aleuts | 0.0 /100 | #298 | Tragic 82.6% |
| Immigrants | Central America | 0.0 /100 | #299 | Tragic 82.5% |
| Hmong | 0.0 /100 | #300 | Tragic 82.4% |
| Hispanics or Latinos | 0.0 /100 | #301 | Tragic 82.4% |
| Ottawa | 0.0 /100 | #302 | Tragic 82.4% |
| Immigrants | Micronesia | 0.0 /100 | #303 | Tragic 82.4% |
| Tlingit-Haida | 0.0 /100 | #304 | Tragic 82.3% |
| Osage | 0.0 /100 | #305 | Tragic 82.3% |
| Spanish American Indians | 0.0 /100 | #306 | Tragic 82.2% |
| Menominee | 0.0 /100 | #307 | Tragic 82.2% |
| Puget Sound Salish | 0.0 /100 | #308 | Tragic 82.1% |