Immigrants from Laos vs Austrian In Labor Force | Age 16-19
COMPARE
Immigrants from Laos
Austrian
In Labor Force | Age 16-19
In Labor Force | Age 16-19 Comparison
Immigrants from Laos
Austrians
40.6%
IN LABOR FORCE | AGE 16-19
100.0/ 100
METRIC RATING
52nd/ 347
METRIC RANK
39.5%
IN LABOR FORCE | AGE 16-19
99.8/ 100
METRIC RATING
78th/ 347
METRIC RANK
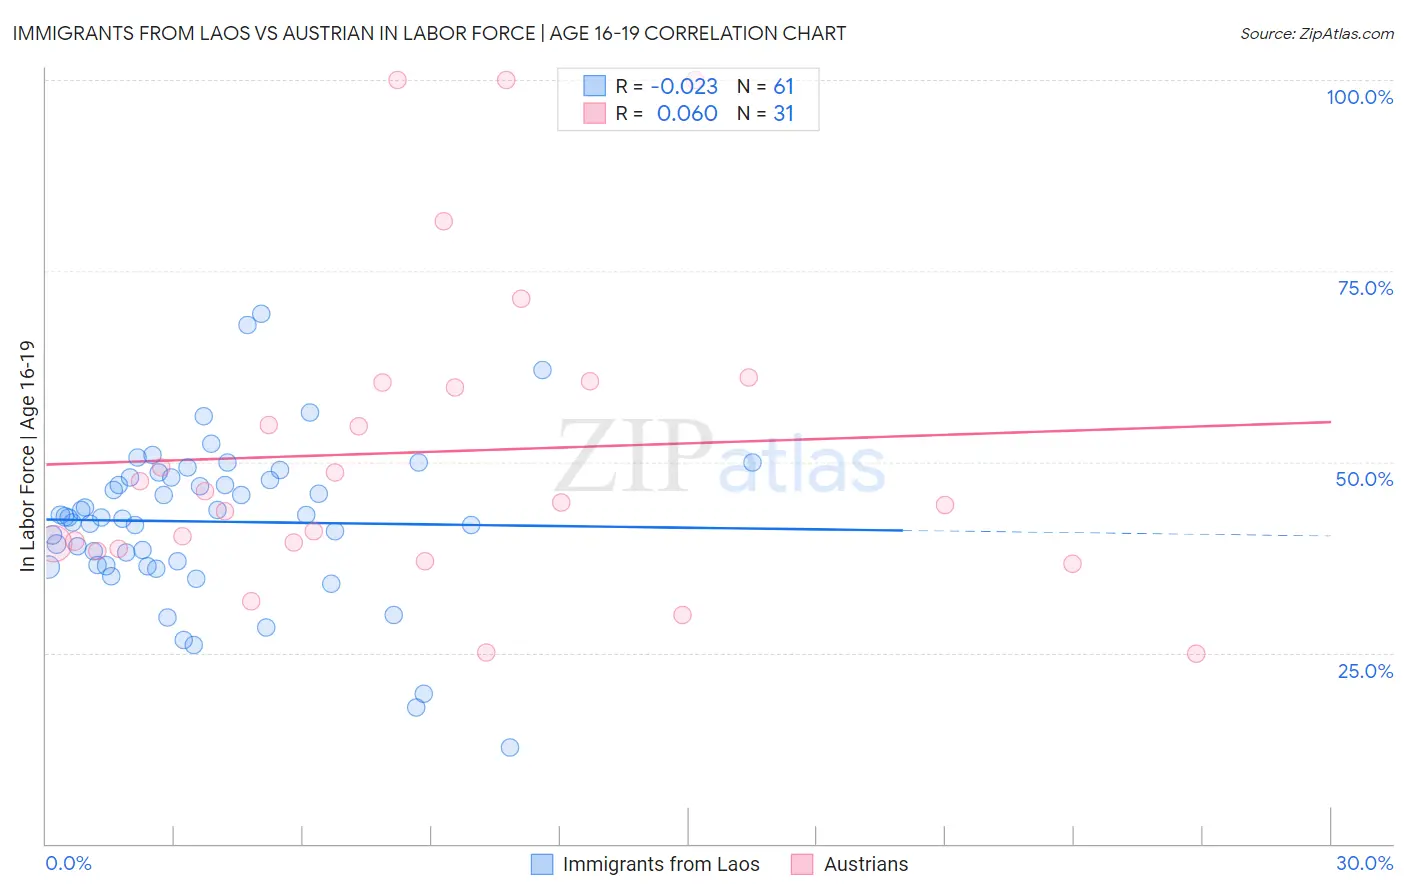
Immigrants from Laos vs Austrian In Labor Force | Age 16-19 Correlation Chart
The statistical analysis conducted on geographies consisting of 201,366,524 people shows no correlation between the proportion of Immigrants from Laos and labor force participation rate among population between the ages 16 and 19 in the United States with a correlation coefficient (R) of -0.023 and weighted average of 40.6%. Similarly, the statistical analysis conducted on geographies consisting of 450,897,610 people shows a slight positive correlation between the proportion of Austrians and labor force participation rate among population between the ages 16 and 19 in the United States with a correlation coefficient (R) of 0.060 and weighted average of 39.5%, a difference of 2.8%.
In Labor Force | Age 16-19 Correlation Summary
| Measurement | Immigrants from Laos | Austrian |
| Minimum | 12.6% | 24.9% |
| Maximum | 69.4% | 100.0% |
| Range | 56.8% | 75.1% |
| Mean | 42.2% | 51.3% |
| Median | 42.8% | 44.7% |
| Interquartile 25% (IQ1) | 36.5% | 38.6% |
| Interquartile 75% (IQ3) | 48.0% | 60.5% |
| Interquartile Range (IQR) | 11.5% | 21.8% |
| Standard Deviation (Sample) | 10.3% | 20.5% |
| Standard Deviation (Population) | 10.3% | 20.2% |
Similar Demographics by In Labor Force | Age 16-19
Demographics Similar to Immigrants from Laos by In Labor Force | Age 16-19
In terms of in labor force | age 16-19, the demographic groups most similar to Immigrants from Laos are Immigrants from Zaire (40.7%, a difference of 0.090%), Indonesian (40.7%, a difference of 0.19%), Immigrants from Kenya (40.5%, a difference of 0.32%), Cree (40.8%, a difference of 0.34%), and Tlingit-Haida (40.5%, a difference of 0.35%).
| Demographics | Rating | Rank | In Labor Force | Age 16-19 |
| Croatians | 100.0 /100 | #45 | Exceptional 41.1% |
| Immigrants | Sudan | 100.0 /100 | #46 | Exceptional 41.0% |
| Carpatho Rusyns | 100.0 /100 | #47 | Exceptional 40.8% |
| Icelanders | 100.0 /100 | #48 | Exceptional 40.8% |
| Cree | 100.0 /100 | #49 | Exceptional 40.8% |
| Indonesians | 100.0 /100 | #50 | Exceptional 40.7% |
| Immigrants | Zaire | 100.0 /100 | #51 | Exceptional 40.7% |
| Immigrants | Laos | 100.0 /100 | #52 | Exceptional 40.6% |
| Immigrants | Kenya | 100.0 /100 | #53 | Exceptional 40.5% |
| Tlingit-Haida | 100.0 /100 | #54 | Exceptional 40.5% |
| British | 100.0 /100 | #55 | Exceptional 40.5% |
| Fijians | 100.0 /100 | #56 | Exceptional 40.4% |
| Lithuanians | 100.0 /100 | #57 | Exceptional 40.4% |
| Aleuts | 100.0 /100 | #58 | Exceptional 40.4% |
| Slavs | 100.0 /100 | #59 | Exceptional 40.4% |
Demographics Similar to Austrians by In Labor Force | Age 16-19
In terms of in labor force | age 16-19, the demographic groups most similar to Austrians are Marshallese (39.5%, a difference of 0.13%), Immigrants from Iraq (39.4%, a difference of 0.31%), Immigrants from Portugal (39.7%, a difference of 0.39%), Malaysian (39.7%, a difference of 0.52%), and Shoshone (39.3%, a difference of 0.59%).
| Demographics | Rating | Rank | In Labor Force | Age 16-19 |
| Serbians | 99.9 /100 | #71 | Exceptional 39.9% |
| Iroquois | 99.9 /100 | #72 | Exceptional 39.9% |
| Immigrants | Middle Africa | 99.9 /100 | #73 | Exceptional 39.9% |
| Hungarians | 99.9 /100 | #74 | Exceptional 39.8% |
| French American Indians | 99.9 /100 | #75 | Exceptional 39.8% |
| Malaysians | 99.9 /100 | #76 | Exceptional 39.7% |
| Immigrants | Portugal | 99.9 /100 | #77 | Exceptional 39.7% |
| Austrians | 99.8 /100 | #78 | Exceptional 39.5% |
| Marshallese | 99.8 /100 | #79 | Exceptional 39.5% |
| Immigrants | Iraq | 99.8 /100 | #80 | Exceptional 39.4% |
| Shoshone | 99.7 /100 | #81 | Exceptional 39.3% |
| Basques | 99.7 /100 | #82 | Exceptional 39.3% |
| Spanish | 99.7 /100 | #83 | Exceptional 39.3% |
| Immigrants | Uganda | 99.7 /100 | #84 | Exceptional 39.2% |
| Creek | 99.6 /100 | #85 | Exceptional 39.1% |