Immigrants from Laos vs Portuguese In Labor Force | Age 16-19
COMPARE
Immigrants from Laos
Portuguese
In Labor Force | Age 16-19
In Labor Force | Age 16-19 Comparison
Immigrants from Laos
Portuguese
40.6%
IN LABOR FORCE | AGE 16-19
100.0/ 100
METRIC RATING
52nd/ 347
METRIC RANK
40.0%
IN LABOR FORCE | AGE 16-19
99.9/ 100
METRIC RATING
70th/ 347
METRIC RANK
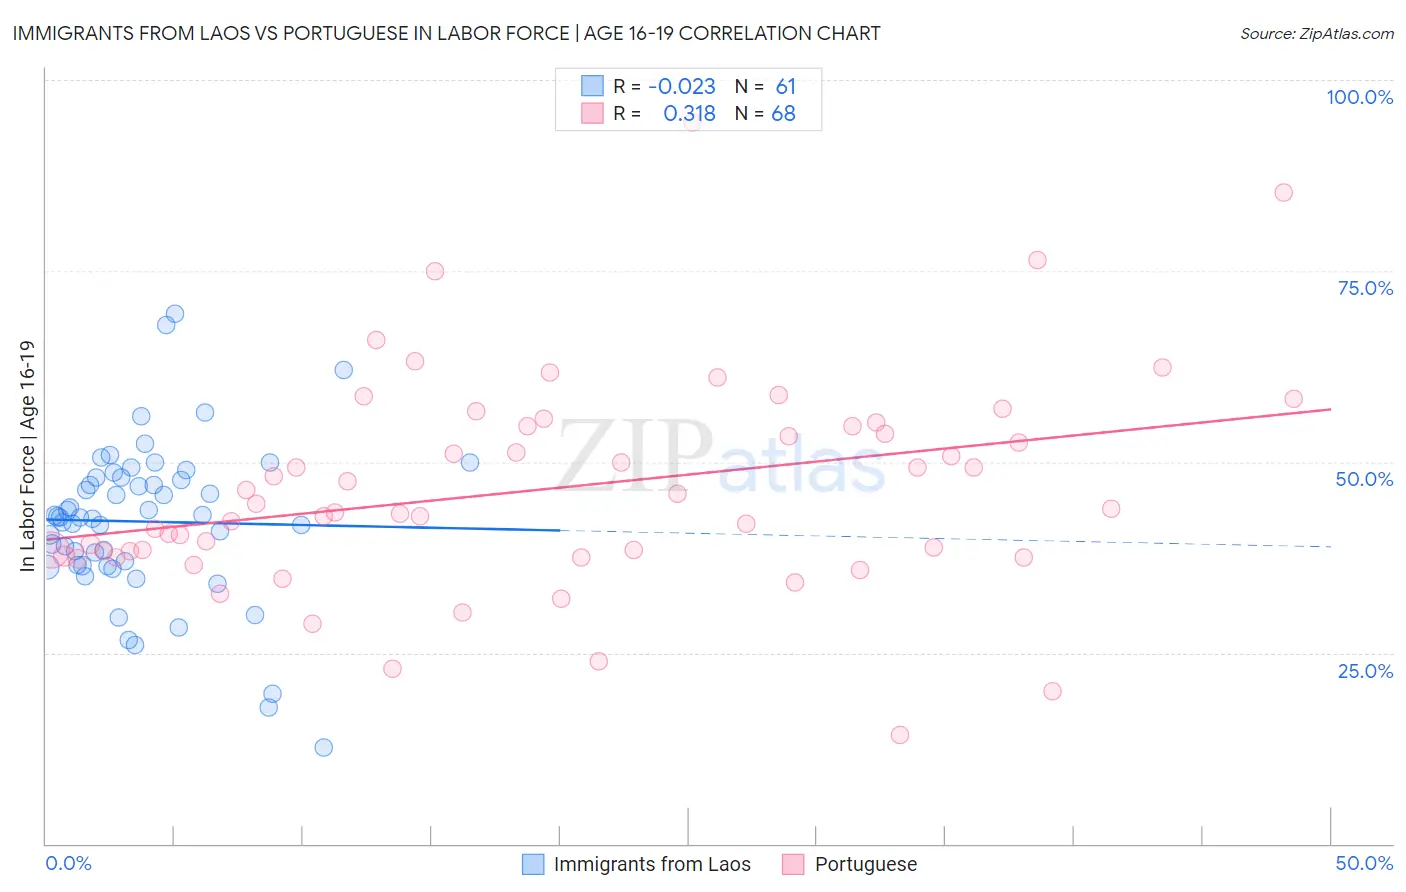
Immigrants from Laos vs Portuguese In Labor Force | Age 16-19 Correlation Chart
The statistical analysis conducted on geographies consisting of 201,366,524 people shows no correlation between the proportion of Immigrants from Laos and labor force participation rate among population between the ages 16 and 19 in the United States with a correlation coefficient (R) of -0.023 and weighted average of 40.6%. Similarly, the statistical analysis conducted on geographies consisting of 449,088,849 people shows a mild positive correlation between the proportion of Portuguese and labor force participation rate among population between the ages 16 and 19 in the United States with a correlation coefficient (R) of 0.318 and weighted average of 40.0%, a difference of 1.5%.
In Labor Force | Age 16-19 Correlation Summary
| Measurement | Immigrants from Laos | Portuguese |
| Minimum | 12.6% | 14.2% |
| Maximum | 69.4% | 94.4% |
| Range | 56.8% | 80.2% |
| Mean | 42.2% | 46.5% |
| Median | 42.8% | 43.6% |
| Interquartile 25% (IQ1) | 36.5% | 38.0% |
| Interquartile 75% (IQ3) | 48.0% | 54.6% |
| Interquartile Range (IQR) | 11.5% | 16.7% |
| Standard Deviation (Sample) | 10.3% | 14.1% |
| Standard Deviation (Population) | 10.3% | 14.0% |
Demographics Similar to Immigrants from Laos and Portuguese by In Labor Force | Age 16-19
In terms of in labor force | age 16-19, the demographic groups most similar to Immigrants from Laos are Immigrants from Zaire (40.7%, a difference of 0.090%), Immigrants from Kenya (40.5%, a difference of 0.32%), Tlingit-Haida (40.5%, a difference of 0.35%), British (40.5%, a difference of 0.38%), and Fijian (40.4%, a difference of 0.46%). Similarly, the demographic groups most similar to Portuguese are Potawatomi (40.0%, a difference of 0.050%), Italian (40.1%, a difference of 0.12%), Serbian (39.9%, a difference of 0.17%), Canadian (40.1%, a difference of 0.18%), and Nonimmigrants (40.1%, a difference of 0.19%).
| Demographics | Rating | Rank | In Labor Force | Age 16-19 |
| Immigrants | Zaire | 100.0 /100 | #51 | Exceptional 40.7% |
| Immigrants | Laos | 100.0 /100 | #52 | Exceptional 40.6% |
| Immigrants | Kenya | 100.0 /100 | #53 | Exceptional 40.5% |
| Tlingit-Haida | 100.0 /100 | #54 | Exceptional 40.5% |
| British | 100.0 /100 | #55 | Exceptional 40.5% |
| Fijians | 100.0 /100 | #56 | Exceptional 40.4% |
| Lithuanians | 100.0 /100 | #57 | Exceptional 40.4% |
| Aleuts | 100.0 /100 | #58 | Exceptional 40.4% |
| Slavs | 100.0 /100 | #59 | Exceptional 40.4% |
| Immigrants | Eastern Africa | 100.0 /100 | #60 | Exceptional 40.4% |
| Americans | 100.0 /100 | #61 | Exceptional 40.3% |
| Cherokee | 100.0 /100 | #62 | Exceptional 40.2% |
| Northern Europeans | 100.0 /100 | #63 | Exceptional 40.2% |
| Immigrants | Micronesia | 100.0 /100 | #64 | Exceptional 40.2% |
| Kenyans | 100.0 /100 | #65 | Exceptional 40.1% |
| Immigrants | Nonimmigrants | 100.0 /100 | #66 | Exceptional 40.1% |
| Canadians | 100.0 /100 | #67 | Exceptional 40.1% |
| Italians | 99.9 /100 | #68 | Exceptional 40.1% |
| Potawatomi | 99.9 /100 | #69 | Exceptional 40.0% |
| Portuguese | 99.9 /100 | #70 | Exceptional 40.0% |
| Serbians | 99.9 /100 | #71 | Exceptional 39.9% |