Alaska Native vs Austrian In Labor Force | Age 16-19
COMPARE
Alaska Native
Austrian
In Labor Force | Age 16-19
In Labor Force | Age 16-19 Comparison
Alaska Natives
Austrians
39.1%
IN LABOR FORCE | AGE 16-19
99.6/ 100
METRIC RATING
89th/ 347
METRIC RANK
39.5%
IN LABOR FORCE | AGE 16-19
99.8/ 100
METRIC RATING
78th/ 347
METRIC RANK
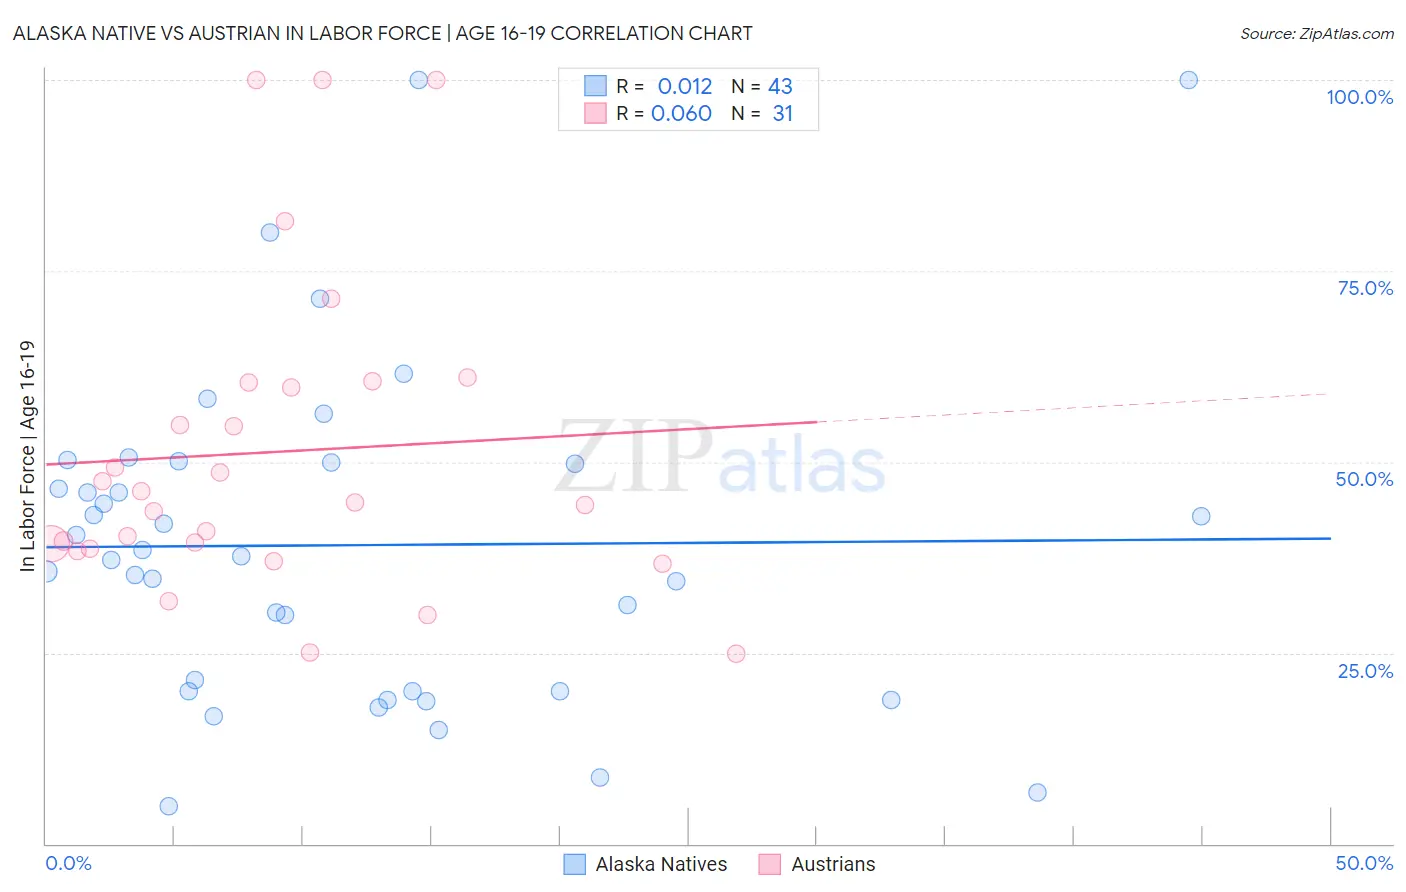
Alaska Native vs Austrian In Labor Force | Age 16-19 Correlation Chart
The statistical analysis conducted on geographies consisting of 76,723,647 people shows no correlation between the proportion of Alaska Natives and labor force participation rate among population between the ages 16 and 19 in the United States with a correlation coefficient (R) of 0.012 and weighted average of 39.1%. Similarly, the statistical analysis conducted on geographies consisting of 450,897,610 people shows a slight positive correlation between the proportion of Austrians and labor force participation rate among population between the ages 16 and 19 in the United States with a correlation coefficient (R) of 0.060 and weighted average of 39.5%, a difference of 1.1%.
In Labor Force | Age 16-19 Correlation Summary
| Measurement | Alaska Native | Austrian |
| Minimum | 4.9% | 24.9% |
| Maximum | 100.0% | 100.0% |
| Range | 95.1% | 75.1% |
| Mean | 39.1% | 51.3% |
| Median | 37.6% | 44.7% |
| Interquartile 25% (IQ1) | 20.0% | 38.6% |
| Interquartile 75% (IQ3) | 50.0% | 60.5% |
| Interquartile Range (IQR) | 30.0% | 21.8% |
| Standard Deviation (Sample) | 21.7% | 20.5% |
| Standard Deviation (Population) | 21.4% | 20.2% |
Demographics Similar to Alaska Natives and Austrians by In Labor Force | Age 16-19
In terms of in labor force | age 16-19, the demographic groups most similar to Alaska Natives are Puget Sound Salish (39.1%, a difference of 0.010%), Immigrants from Germany (39.1%, a difference of 0.080%), Immigrants from Burma/Myanmar (39.0%, a difference of 0.080%), Samoan (39.1%, a difference of 0.16%), and Creek (39.1%, a difference of 0.18%). Similarly, the demographic groups most similar to Austrians are Marshallese (39.5%, a difference of 0.13%), Immigrants from Iraq (39.4%, a difference of 0.31%), Immigrants from Portugal (39.7%, a difference of 0.39%), Malaysian (39.7%, a difference of 0.52%), and Shoshone (39.3%, a difference of 0.59%).
| Demographics | Rating | Rank | In Labor Force | Age 16-19 |
| Immigrants | Middle Africa | 99.9 /100 | #73 | Exceptional 39.9% |
| Hungarians | 99.9 /100 | #74 | Exceptional 39.8% |
| French American Indians | 99.9 /100 | #75 | Exceptional 39.8% |
| Malaysians | 99.9 /100 | #76 | Exceptional 39.7% |
| Immigrants | Portugal | 99.9 /100 | #77 | Exceptional 39.7% |
| Austrians | 99.8 /100 | #78 | Exceptional 39.5% |
| Marshallese | 99.8 /100 | #79 | Exceptional 39.5% |
| Immigrants | Iraq | 99.8 /100 | #80 | Exceptional 39.4% |
| Shoshone | 99.7 /100 | #81 | Exceptional 39.3% |
| Basques | 99.7 /100 | #82 | Exceptional 39.3% |
| Spanish | 99.7 /100 | #83 | Exceptional 39.3% |
| Immigrants | Uganda | 99.7 /100 | #84 | Exceptional 39.2% |
| Creek | 99.6 /100 | #85 | Exceptional 39.1% |
| Samoans | 99.6 /100 | #86 | Exceptional 39.1% |
| Immigrants | Germany | 99.6 /100 | #87 | Exceptional 39.1% |
| Puget Sound Salish | 99.6 /100 | #88 | Exceptional 39.1% |
| Alaska Natives | 99.6 /100 | #89 | Exceptional 39.1% |
| Immigrants | Burma/Myanmar | 99.5 /100 | #90 | Exceptional 39.0% |
| Spanish Americans | 99.5 /100 | #91 | Exceptional 39.0% |
| Osage | 99.4 /100 | #92 | Exceptional 39.0% |
| Blackfeet | 99.4 /100 | #93 | Exceptional 38.9% |