Immigrants from Laos vs Austrian Currently Married
COMPARE
Immigrants from Laos
Austrian
Currently Married
Currently Married Comparison
Immigrants from Laos
Austrians
45.0%
CURRENTLY MARRIED
2.3/ 100
METRIC RATING
223rd/ 347
METRIC RANK
48.7%
CURRENTLY MARRIED
99.2/ 100
METRIC RATING
48th/ 347
METRIC RANK
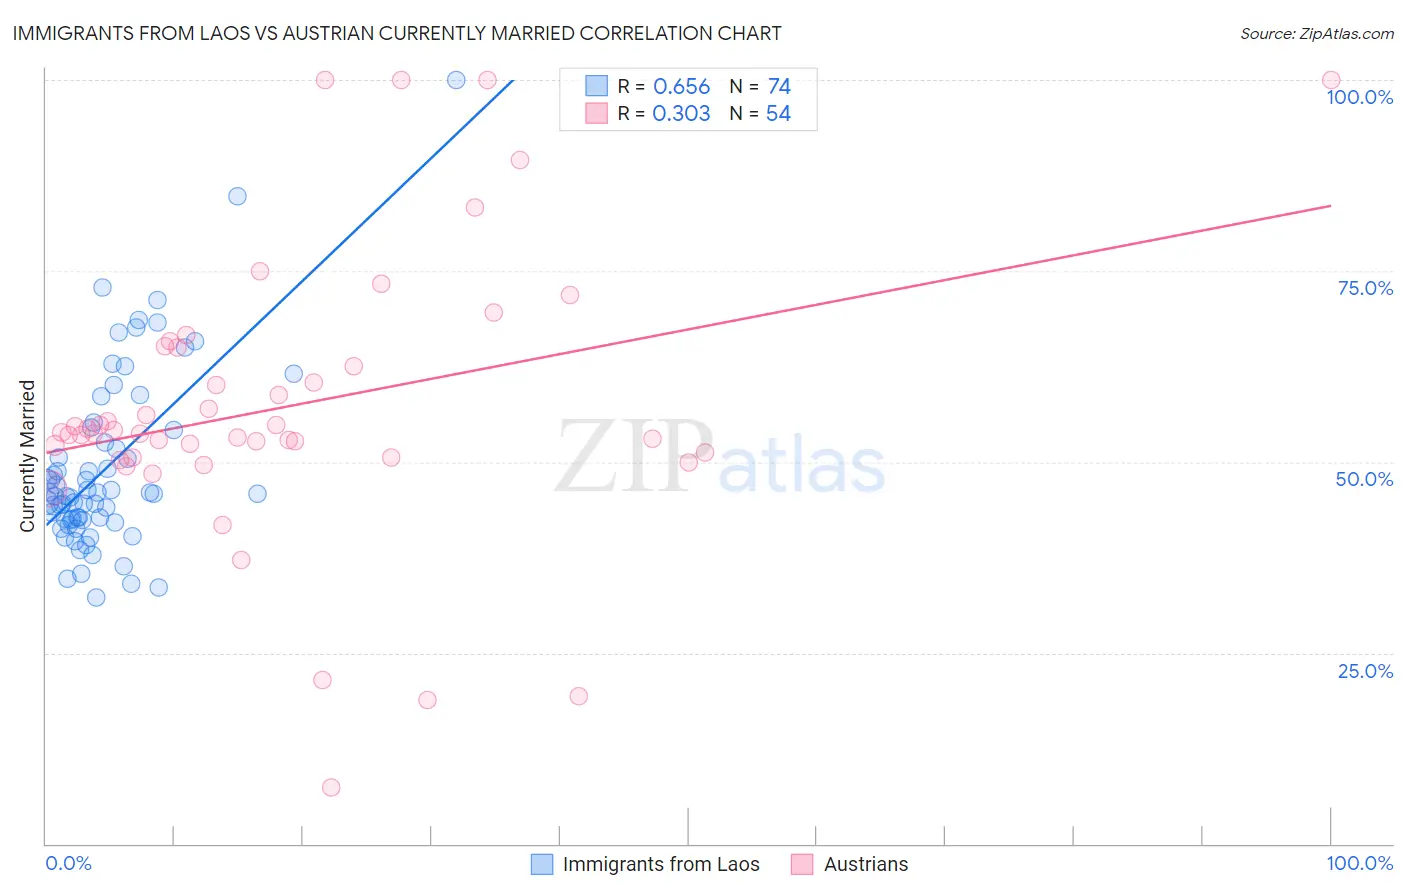
Immigrants from Laos vs Austrian Currently Married Correlation Chart
The statistical analysis conducted on geographies consisting of 201,475,641 people shows a significant positive correlation between the proportion of Immigrants from Laos and percentage of population currently married in the United States with a correlation coefficient (R) of 0.656 and weighted average of 45.0%. Similarly, the statistical analysis conducted on geographies consisting of 452,025,690 people shows a mild positive correlation between the proportion of Austrians and percentage of population currently married in the United States with a correlation coefficient (R) of 0.303 and weighted average of 48.7%, a difference of 8.1%.
Currently Married Correlation Summary
| Measurement | Immigrants from Laos | Austrian |
| Minimum | 32.3% | 7.4% |
| Maximum | 100.0% | 100.0% |
| Range | 67.7% | 92.6% |
| Mean | 49.4% | 57.2% |
| Median | 45.9% | 53.8% |
| Interquartile 25% (IQ1) | 42.3% | 50.6% |
| Interquartile 75% (IQ3) | 54.1% | 64.9% |
| Interquartile Range (IQR) | 11.8% | 14.3% |
| Standard Deviation (Sample) | 12.1% | 18.6% |
| Standard Deviation (Population) | 12.0% | 18.5% |
Similar Demographics by Currently Married
Demographics Similar to Immigrants from Laos by Currently Married
In terms of currently married, the demographic groups most similar to Immigrants from Laos are Immigrants from Uganda (45.0%, a difference of 0.050%), French American Indian (45.0%, a difference of 0.050%), Immigrants from the Azores (45.1%, a difference of 0.080%), Comanche (45.0%, a difference of 0.10%), and Spanish American (45.0%, a difference of 0.10%).
| Demographics | Rating | Rank | Currently Married |
| Immigrants | Morocco | 5.5 /100 | #216 | Tragic 45.4% |
| Immigrants | Thailand | 5.1 /100 | #217 | Tragic 45.4% |
| Panamanians | 4.0 /100 | #218 | Tragic 45.3% |
| Immigrants | Portugal | 3.5 /100 | #219 | Tragic 45.2% |
| Kenyans | 3.1 /100 | #220 | Tragic 45.2% |
| Mexicans | 3.0 /100 | #221 | Tragic 45.2% |
| Immigrants | Azores | 2.5 /100 | #222 | Tragic 45.1% |
| Immigrants | Laos | 2.3 /100 | #223 | Tragic 45.0% |
| Immigrants | Uganda | 2.2 /100 | #224 | Tragic 45.0% |
| French American Indians | 2.2 /100 | #225 | Tragic 45.0% |
| Comanche | 2.1 /100 | #226 | Tragic 45.0% |
| Spanish Americans | 2.1 /100 | #227 | Tragic 45.0% |
| Immigrants | Uruguay | 2.0 /100 | #228 | Tragic 45.0% |
| Cree | 1.7 /100 | #229 | Tragic 44.9% |
| Immigrants | Kenya | 1.6 /100 | #230 | Tragic 44.9% |
Demographics Similar to Austrians by Currently Married
In terms of currently married, the demographic groups most similar to Austrians are Northern European (48.7%, a difference of 0.010%), Immigrants from Iran (48.7%, a difference of 0.020%), Belgian (48.7%, a difference of 0.050%), Immigrants from North America (48.7%, a difference of 0.080%), and Finnish (48.8%, a difference of 0.11%).
| Demographics | Rating | Rank | Currently Married |
| Greeks | 99.3 /100 | #41 | Exceptional 48.8% |
| Finns | 99.3 /100 | #42 | Exceptional 48.8% |
| Scotch-Irish | 99.3 /100 | #43 | Exceptional 48.7% |
| Immigrants | North America | 99.3 /100 | #44 | Exceptional 48.7% |
| Belgians | 99.3 /100 | #45 | Exceptional 48.7% |
| Immigrants | Iran | 99.2 /100 | #46 | Exceptional 48.7% |
| Northern Europeans | 99.2 /100 | #47 | Exceptional 48.7% |
| Austrians | 99.2 /100 | #48 | Exceptional 48.7% |
| Bhutanese | 99.1 /100 | #49 | Exceptional 48.6% |
| Iranians | 99.0 /100 | #50 | Exceptional 48.6% |
| Whites/Caucasians | 99.0 /100 | #51 | Exceptional 48.6% |
| Russians | 98.9 /100 | #52 | Exceptional 48.6% |
| Immigrants | Austria | 98.8 /100 | #53 | Exceptional 48.5% |
| Immigrants | Moldova | 98.7 /100 | #54 | Exceptional 48.5% |
| Immigrants | North Macedonia | 98.7 /100 | #55 | Exceptional 48.5% |