Immigrants from Korea vs Portuguese In Labor Force | Age 16-19
COMPARE
Immigrants from Korea
Portuguese
In Labor Force | Age 16-19
In Labor Force | Age 16-19 Comparison
Immigrants from Korea
Portuguese
33.8%
IN LABOR FORCE | AGE 16-19
0.3/ 100
METRIC RATING
282nd/ 347
METRIC RANK
40.0%
IN LABOR FORCE | AGE 16-19
99.9/ 100
METRIC RATING
70th/ 347
METRIC RANK
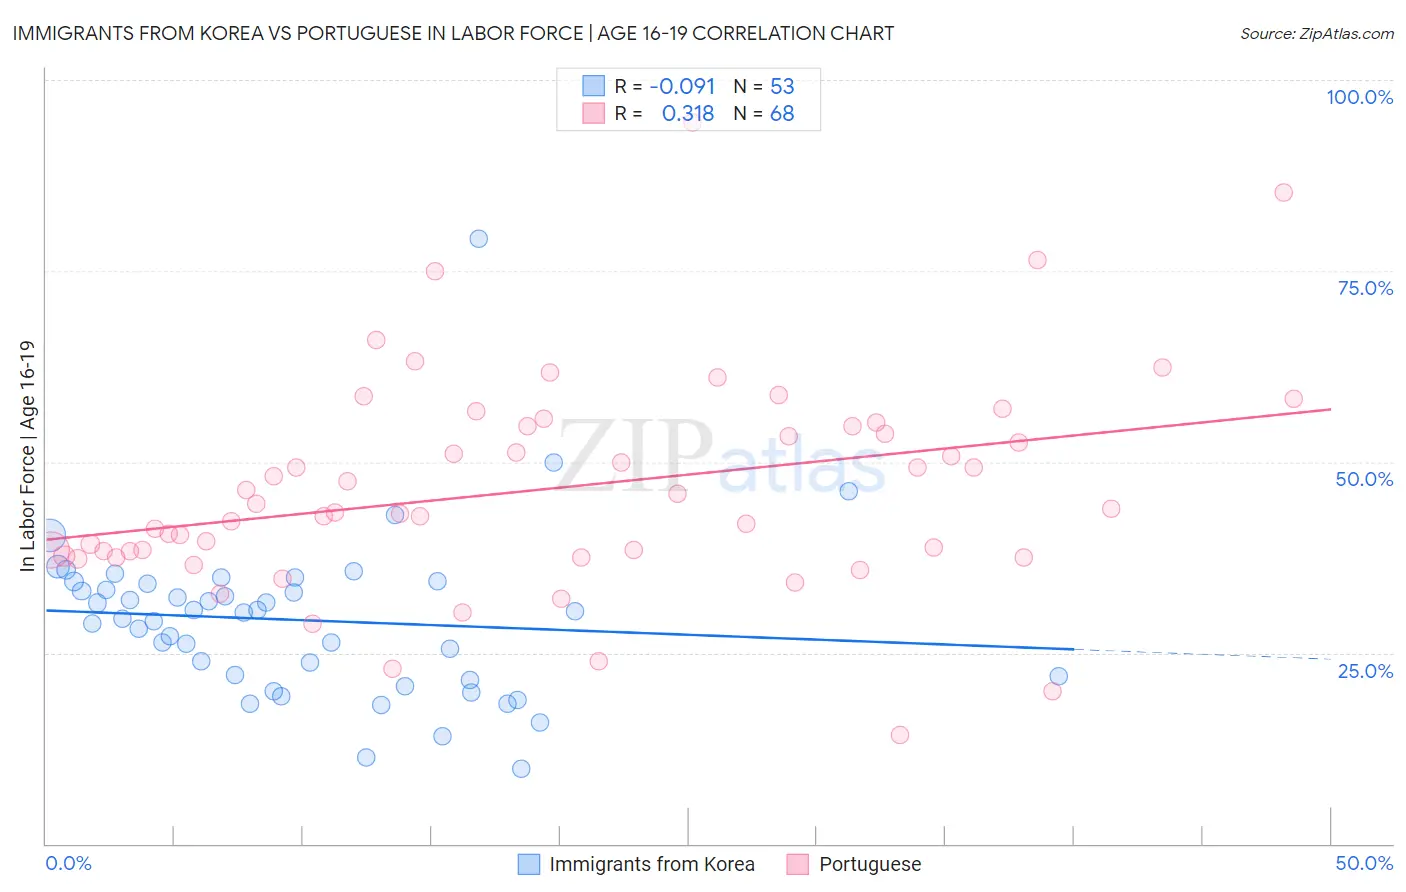
Immigrants from Korea vs Portuguese In Labor Force | Age 16-19 Correlation Chart
The statistical analysis conducted on geographies consisting of 415,630,206 people shows a slight negative correlation between the proportion of Immigrants from Korea and labor force participation rate among population between the ages 16 and 19 in the United States with a correlation coefficient (R) of -0.091 and weighted average of 33.8%. Similarly, the statistical analysis conducted on geographies consisting of 449,088,849 people shows a mild positive correlation between the proportion of Portuguese and labor force participation rate among population between the ages 16 and 19 in the United States with a correlation coefficient (R) of 0.318 and weighted average of 40.0%, a difference of 18.3%.
In Labor Force | Age 16-19 Correlation Summary
| Measurement | Immigrants from Korea | Portuguese |
| Minimum | 9.8% | 14.2% |
| Maximum | 79.2% | 94.4% |
| Range | 69.4% | 80.2% |
| Mean | 29.3% | 46.5% |
| Median | 30.3% | 43.6% |
| Interquartile 25% (IQ1) | 21.6% | 38.0% |
| Interquartile 75% (IQ3) | 34.2% | 54.6% |
| Interquartile Range (IQR) | 12.6% | 16.7% |
| Standard Deviation (Sample) | 10.9% | 14.1% |
| Standard Deviation (Population) | 10.8% | 14.0% |
Similar Demographics by In Labor Force | Age 16-19
Demographics Similar to Immigrants from Korea by In Labor Force | Age 16-19
In terms of in labor force | age 16-19, the demographic groups most similar to Immigrants from Korea are Cypriot (33.8%, a difference of 0.010%), Paraguayan (33.8%, a difference of 0.020%), Taiwanese (33.8%, a difference of 0.020%), Colombian (33.8%, a difference of 0.030%), and Menominee (33.9%, a difference of 0.11%).
| Demographics | Rating | Rank | In Labor Force | Age 16-19 |
| Immigrants | Fiji | 0.3 /100 | #275 | Tragic 33.9% |
| Immigrants | Latin America | 0.3 /100 | #276 | Tragic 33.9% |
| Menominee | 0.3 /100 | #277 | Tragic 33.9% |
| Colombians | 0.3 /100 | #278 | Tragic 33.8% |
| Paraguayans | 0.3 /100 | #279 | Tragic 33.8% |
| Taiwanese | 0.3 /100 | #280 | Tragic 33.8% |
| Cypriots | 0.3 /100 | #281 | Tragic 33.8% |
| Immigrants | Korea | 0.3 /100 | #282 | Tragic 33.8% |
| Immigrants | Venezuela | 0.2 /100 | #283 | Tragic 33.7% |
| Immigrants | Spain | 0.2 /100 | #284 | Tragic 33.7% |
| U.S. Virgin Islanders | 0.2 /100 | #285 | Tragic 33.6% |
| South Americans | 0.2 /100 | #286 | Tragic 33.6% |
| Nepalese | 0.1 /100 | #287 | Tragic 33.5% |
| Immigrants | Indonesia | 0.1 /100 | #288 | Tragic 33.5% |
| Immigrants | Singapore | 0.1 /100 | #289 | Tragic 33.5% |
Demographics Similar to Portuguese by In Labor Force | Age 16-19
In terms of in labor force | age 16-19, the demographic groups most similar to Portuguese are Potawatomi (40.0%, a difference of 0.050%), Italian (40.1%, a difference of 0.12%), Serbian (39.9%, a difference of 0.17%), Iroquois (39.9%, a difference of 0.17%), and Canadian (40.1%, a difference of 0.18%).
| Demographics | Rating | Rank | In Labor Force | Age 16-19 |
| Northern Europeans | 100.0 /100 | #63 | Exceptional 40.2% |
| Immigrants | Micronesia | 100.0 /100 | #64 | Exceptional 40.2% |
| Kenyans | 100.0 /100 | #65 | Exceptional 40.1% |
| Immigrants | Nonimmigrants | 100.0 /100 | #66 | Exceptional 40.1% |
| Canadians | 100.0 /100 | #67 | Exceptional 40.1% |
| Italians | 99.9 /100 | #68 | Exceptional 40.1% |
| Potawatomi | 99.9 /100 | #69 | Exceptional 40.0% |
| Portuguese | 99.9 /100 | #70 | Exceptional 40.0% |
| Serbians | 99.9 /100 | #71 | Exceptional 39.9% |
| Iroquois | 99.9 /100 | #72 | Exceptional 39.9% |
| Immigrants | Middle Africa | 99.9 /100 | #73 | Exceptional 39.9% |
| Hungarians | 99.9 /100 | #74 | Exceptional 39.8% |
| French American Indians | 99.9 /100 | #75 | Exceptional 39.8% |
| Malaysians | 99.9 /100 | #76 | Exceptional 39.7% |
| Immigrants | Portugal | 99.9 /100 | #77 | Exceptional 39.7% |