Slovene vs Alaska Native In Labor Force | Age 16-19
COMPARE
Slovene
Alaska Native
In Labor Force | Age 16-19
In Labor Force | Age 16-19 Comparison
Slovenes
Alaska Natives
43.7%
IN LABOR FORCE | AGE 16-19
100.0/ 100
METRIC RATING
15th/ 347
METRIC RANK
39.1%
IN LABOR FORCE | AGE 16-19
99.6/ 100
METRIC RATING
89th/ 347
METRIC RANK
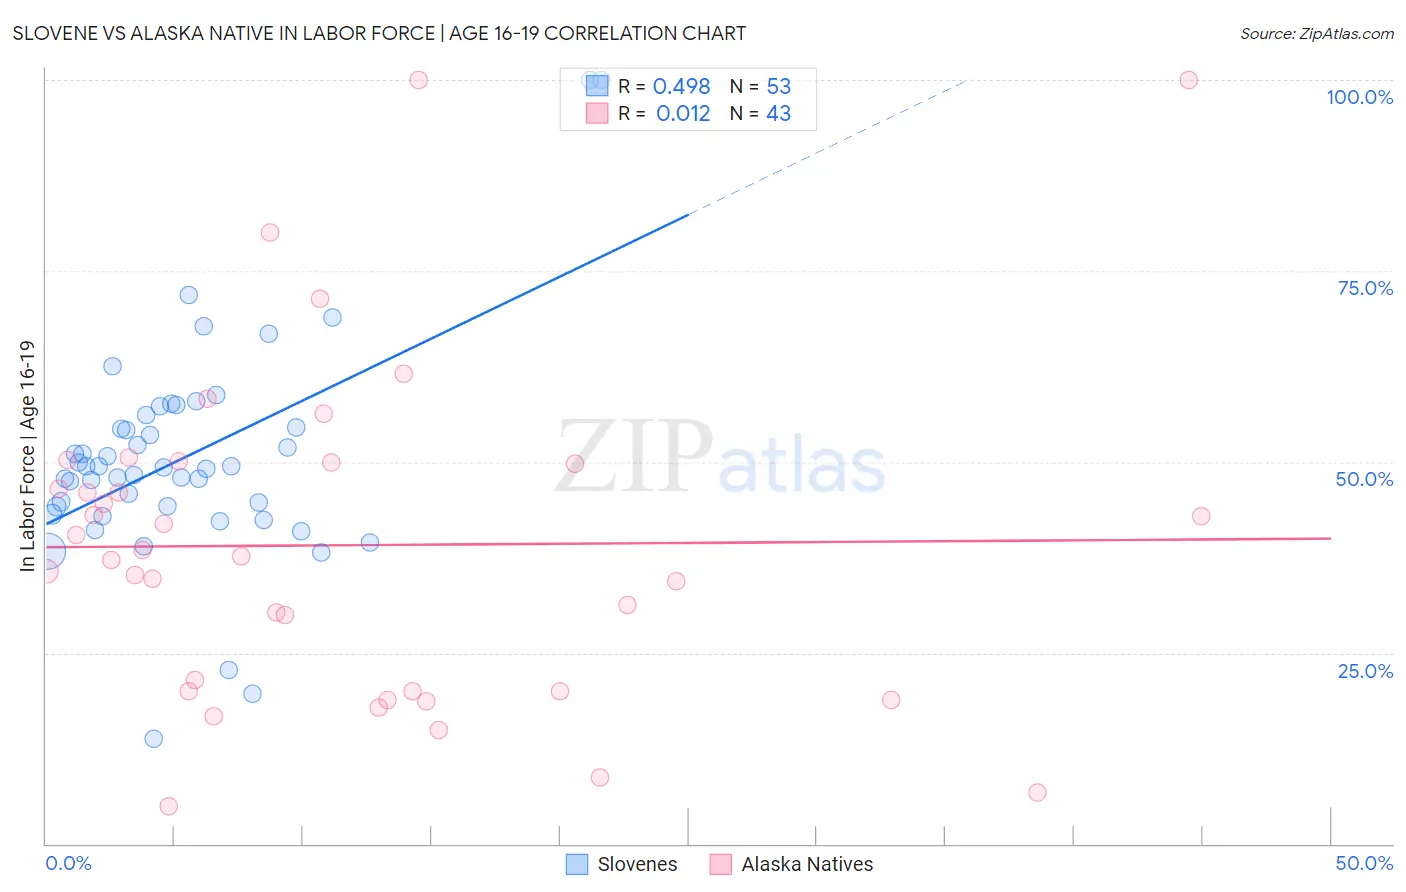
Slovene vs Alaska Native In Labor Force | Age 16-19 Correlation Chart
The statistical analysis conducted on geographies consisting of 261,051,776 people shows a moderate positive correlation between the proportion of Slovenes and labor force participation rate among population between the ages 16 and 19 in the United States with a correlation coefficient (R) of 0.498 and weighted average of 43.7%. Similarly, the statistical analysis conducted on geographies consisting of 76,723,647 people shows no correlation between the proportion of Alaska Natives and labor force participation rate among population between the ages 16 and 19 in the United States with a correlation coefficient (R) of 0.012 and weighted average of 39.1%, a difference of 11.8%.
In Labor Force | Age 16-19 Correlation Summary
| Measurement | Slovene | Alaska Native |
| Minimum | 13.8% | 4.9% |
| Maximum | 100.0% | 100.0% |
| Range | 86.2% | 95.1% |
| Mean | 50.5% | 39.1% |
| Median | 49.2% | 37.6% |
| Interquartile 25% (IQ1) | 43.7% | 20.0% |
| Interquartile 75% (IQ3) | 55.3% | 50.0% |
| Interquartile Range (IQR) | 11.6% | 30.0% |
| Standard Deviation (Sample) | 14.6% | 21.7% |
| Standard Deviation (Population) | 14.4% | 21.4% |
Similar Demographics by In Labor Force | Age 16-19
Demographics Similar to Slovenes by In Labor Force | Age 16-19
In terms of in labor force | age 16-19, the demographic groups most similar to Slovenes are Czech (43.6%, a difference of 0.11%), Scandinavian (43.6%, a difference of 0.17%), French Canadian (43.6%, a difference of 0.25%), Chippewa (43.8%, a difference of 0.26%), and Dutch (43.8%, a difference of 0.36%).
| Demographics | Rating | Rank | In Labor Force | Age 16-19 |
| Immigrants | Cabo Verde | 100.0 /100 | #8 | Exceptional 44.7% |
| Cape Verdeans | 100.0 /100 | #9 | Exceptional 44.5% |
| Germans | 100.0 /100 | #10 | Exceptional 44.2% |
| Swedes | 100.0 /100 | #11 | Exceptional 44.1% |
| Finns | 100.0 /100 | #12 | Exceptional 43.9% |
| Dutch | 100.0 /100 | #13 | Exceptional 43.8% |
| Chippewa | 100.0 /100 | #14 | Exceptional 43.8% |
| Slovenes | 100.0 /100 | #15 | Exceptional 43.7% |
| Czechs | 100.0 /100 | #16 | Exceptional 43.6% |
| Scandinavians | 100.0 /100 | #17 | Exceptional 43.6% |
| French Canadians | 100.0 /100 | #18 | Exceptional 43.6% |
| Belgians | 100.0 /100 | #19 | Exceptional 43.4% |
| Swiss | 100.0 /100 | #20 | Exceptional 43.3% |
| Ottawa | 100.0 /100 | #21 | Exceptional 43.0% |
| Sudanese | 100.0 /100 | #22 | Exceptional 42.9% |
Demographics Similar to Alaska Natives by In Labor Force | Age 16-19
In terms of in labor force | age 16-19, the demographic groups most similar to Alaska Natives are Puget Sound Salish (39.1%, a difference of 0.010%), Immigrants from Germany (39.1%, a difference of 0.080%), Immigrants from Burma/Myanmar (39.0%, a difference of 0.080%), Samoan (39.1%, a difference of 0.16%), and Creek (39.1%, a difference of 0.18%).
| Demographics | Rating | Rank | In Labor Force | Age 16-19 |
| Basques | 99.7 /100 | #82 | Exceptional 39.3% |
| Spanish | 99.7 /100 | #83 | Exceptional 39.3% |
| Immigrants | Uganda | 99.7 /100 | #84 | Exceptional 39.2% |
| Creek | 99.6 /100 | #85 | Exceptional 39.1% |
| Samoans | 99.6 /100 | #86 | Exceptional 39.1% |
| Immigrants | Germany | 99.6 /100 | #87 | Exceptional 39.1% |
| Puget Sound Salish | 99.6 /100 | #88 | Exceptional 39.1% |
| Alaska Natives | 99.6 /100 | #89 | Exceptional 39.1% |
| Immigrants | Burma/Myanmar | 99.5 /100 | #90 | Exceptional 39.0% |
| Spanish Americans | 99.5 /100 | #91 | Exceptional 39.0% |
| Osage | 99.4 /100 | #92 | Exceptional 39.0% |
| Blackfeet | 99.4 /100 | #93 | Exceptional 38.9% |
| Immigrants | Canada | 99.4 /100 | #94 | Exceptional 38.9% |
| Immigrants | North America | 99.4 /100 | #95 | Exceptional 38.9% |
| Latvians | 99.4 /100 | #96 | Exceptional 38.9% |