Immigrants from Kazakhstan vs Immigrants from Zimbabwe In Labor Force | Age 30-34
COMPARE
Immigrants from Kazakhstan
Immigrants from Zimbabwe
In Labor Force | Age 30-34
In Labor Force | Age 30-34 Comparison
Immigrants from Kazakhstan
Immigrants from Zimbabwe
85.3%
IN LABOR FORCE | AGE 30-34
98.1/ 100
METRIC RATING
89th/ 347
METRIC RANK
85.1%
IN LABOR FORCE | AGE 30-34
95.8/ 100
METRIC RATING
108th/ 347
METRIC RANK
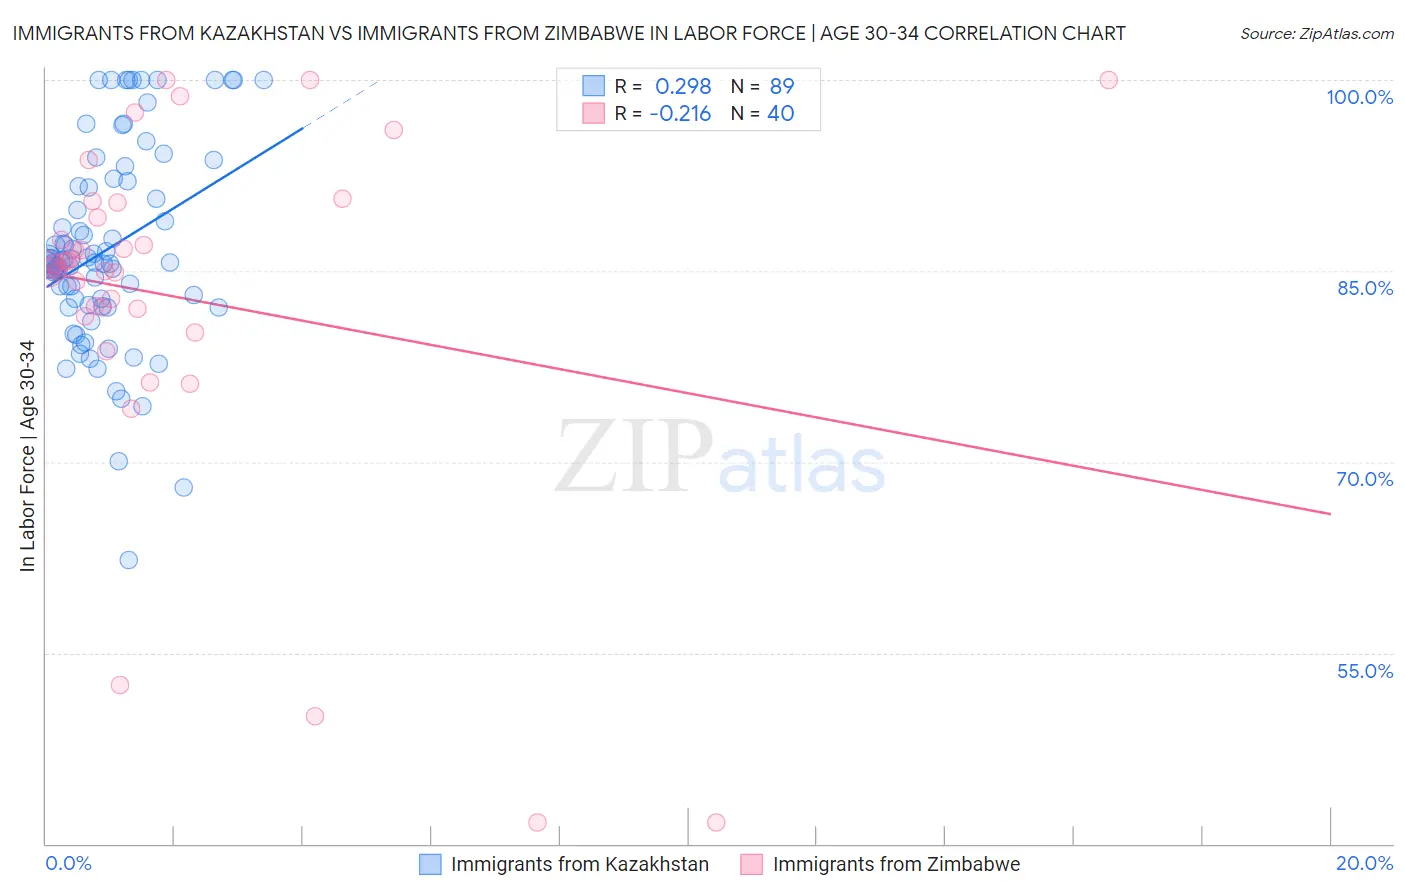
Immigrants from Kazakhstan vs Immigrants from Zimbabwe In Labor Force | Age 30-34 Correlation Chart
The statistical analysis conducted on geographies consisting of 124,415,463 people shows a weak positive correlation between the proportion of Immigrants from Kazakhstan and labor force participation rate among population between the ages 30 and 34 in the United States with a correlation coefficient (R) of 0.298 and weighted average of 85.3%. Similarly, the statistical analysis conducted on geographies consisting of 117,799,527 people shows a weak negative correlation between the proportion of Immigrants from Zimbabwe and labor force participation rate among population between the ages 30 and 34 in the United States with a correlation coefficient (R) of -0.216 and weighted average of 85.1%, a difference of 0.14%.
In Labor Force | Age 30-34 Correlation Summary
| Measurement | Immigrants from Kazakhstan | Immigrants from Zimbabwe |
| Minimum | 62.3% | 41.7% |
| Maximum | 100.0% | 100.0% |
| Range | 37.7% | 58.3% |
| Mean | 86.7% | 82.9% |
| Median | 85.7% | 85.4% |
| Interquartile 25% (IQ1) | 82.3% | 81.8% |
| Interquartile 75% (IQ3) | 91.8% | 89.8% |
| Interquartile Range (IQR) | 9.5% | 8.0% |
| Standard Deviation (Sample) | 7.8% | 13.9% |
| Standard Deviation (Population) | 7.8% | 13.8% |
Demographics Similar to Immigrants from Kazakhstan and Immigrants from Zimbabwe by In Labor Force | Age 30-34
In terms of in labor force | age 30-34, the demographic groups most similar to Immigrants from Kazakhstan are Immigrants from Belgium (85.3%, a difference of 0.010%), Burmese (85.3%, a difference of 0.020%), Immigrants from Moldova (85.3%, a difference of 0.020%), German Russian (85.2%, a difference of 0.030%), and Immigrants from Norway (85.2%, a difference of 0.040%). Similarly, the demographic groups most similar to Immigrants from Zimbabwe are Immigrants from Northern Africa (85.2%, a difference of 0.020%), Alsatian (85.2%, a difference of 0.030%), Immigrants from Middle Africa (85.2%, a difference of 0.030%), Ukrainian (85.2%, a difference of 0.040%), and Immigrants from Ghana (85.2%, a difference of 0.040%).
| Demographics | Rating | Rank | In Labor Force | Age 30-34 |
| Immigrants | Belgium | 98.2 /100 | #88 | Exceptional 85.3% |
| Immigrants | Kazakhstan | 98.1 /100 | #89 | Exceptional 85.3% |
| Burmese | 97.9 /100 | #90 | Exceptional 85.3% |
| Immigrants | Moldova | 97.9 /100 | #91 | Exceptional 85.3% |
| German Russians | 97.7 /100 | #92 | Exceptional 85.2% |
| Immigrants | Norway | 97.6 /100 | #93 | Exceptional 85.2% |
| Swedes | 97.5 /100 | #94 | Exceptional 85.2% |
| Immigrants | India | 97.4 /100 | #95 | Exceptional 85.2% |
| Immigrants | Korea | 97.3 /100 | #96 | Exceptional 85.2% |
| Thais | 97.2 /100 | #97 | Exceptional 85.2% |
| Immigrants | Uganda | 97.2 /100 | #98 | Exceptional 85.2% |
| Belgians | 97.2 /100 | #99 | Exceptional 85.2% |
| Sudanese | 97.1 /100 | #100 | Exceptional 85.2% |
| Immigrants | Belarus | 96.9 /100 | #101 | Exceptional 85.2% |
| Immigrants | Austria | 96.8 /100 | #102 | Exceptional 85.2% |
| Ukrainians | 96.6 /100 | #103 | Exceptional 85.2% |
| Immigrants | Ghana | 96.5 /100 | #104 | Exceptional 85.2% |
| Alsatians | 96.3 /100 | #105 | Exceptional 85.2% |
| Immigrants | Middle Africa | 96.3 /100 | #106 | Exceptional 85.2% |
| Immigrants | Northern Africa | 96.3 /100 | #107 | Exceptional 85.2% |
| Immigrants | Zimbabwe | 95.8 /100 | #108 | Exceptional 85.1% |