Immigrants from Latvia vs Scotch-Irish In Labor Force | Age 25-29
COMPARE
Immigrants from Latvia
Scotch-Irish
In Labor Force | Age 25-29
In Labor Force | Age 25-29 Comparison
Immigrants from Latvia
Scotch-Irish
85.6%
IN LABOR FORCE | AGE 25-29
99.8/ 100
METRIC RATING
51st/ 347
METRIC RANK
84.2%
IN LABOR FORCE | AGE 25-29
6.5/ 100
METRIC RATING
223rd/ 347
METRIC RANK
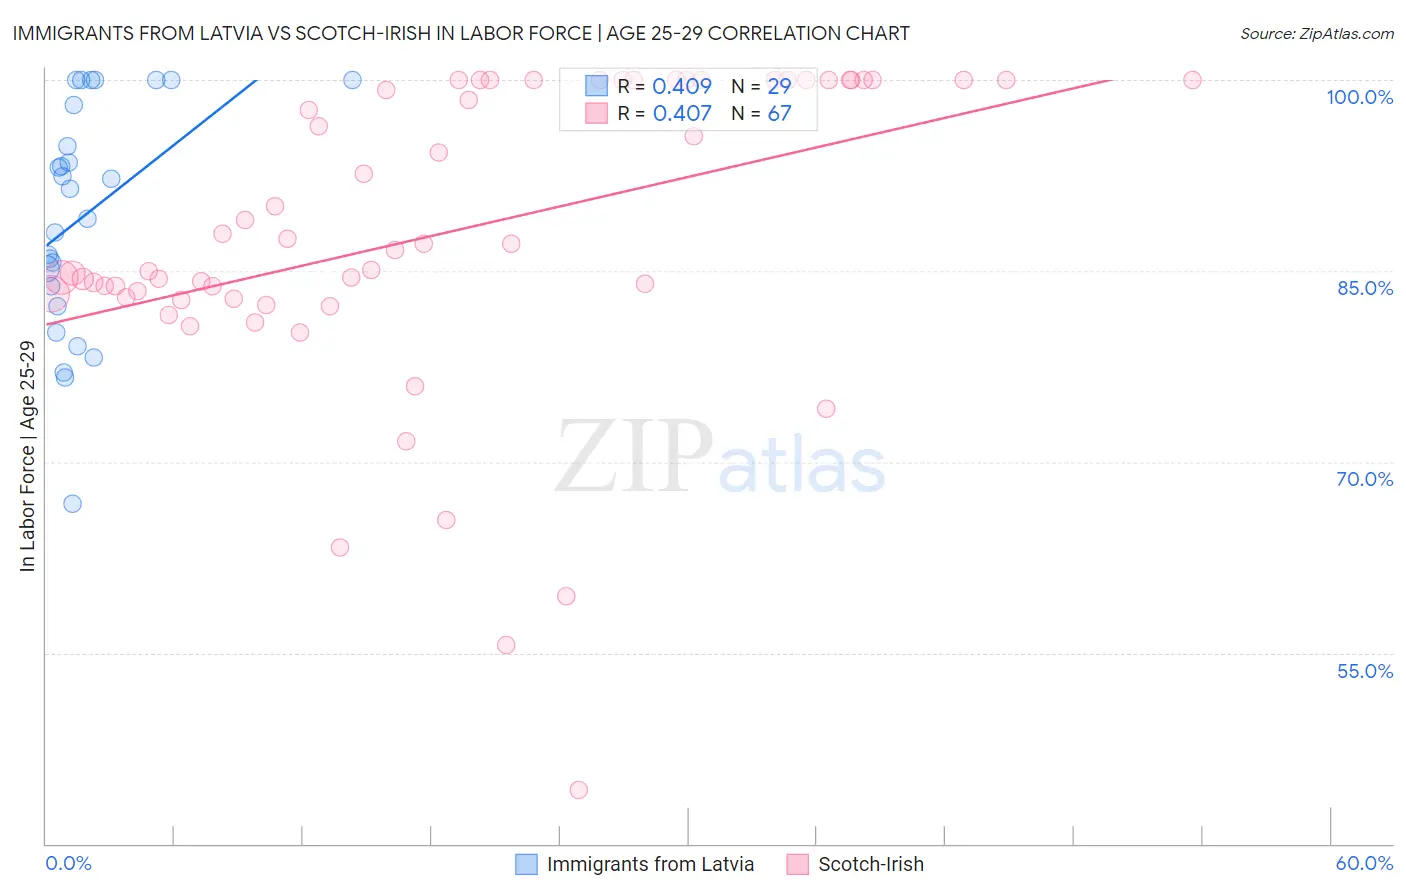
Immigrants from Latvia vs Scotch-Irish In Labor Force | Age 25-29 Correlation Chart
The statistical analysis conducted on geographies consisting of 113,730,924 people shows a moderate positive correlation between the proportion of Immigrants from Latvia and labor force participation rate among population between the ages 25 and 29 in the United States with a correlation coefficient (R) of 0.409 and weighted average of 85.6%. Similarly, the statistical analysis conducted on geographies consisting of 547,797,884 people shows a moderate positive correlation between the proportion of Scotch-Irish and labor force participation rate among population between the ages 25 and 29 in the United States with a correlation coefficient (R) of 0.407 and weighted average of 84.2%, a difference of 1.6%.
In Labor Force | Age 25-29 Correlation Summary
| Measurement | Immigrants from Latvia | Scotch-Irish |
| Minimum | 66.7% | 44.2% |
| Maximum | 100.0% | 100.0% |
| Range | 33.3% | 55.8% |
| Mean | 89.4% | 88.0% |
| Median | 91.5% | 87.1% |
| Interquartile 25% (IQ1) | 83.0% | 82.9% |
| Interquartile 75% (IQ3) | 99.0% | 100.0% |
| Interquartile Range (IQR) | 16.0% | 17.1% |
| Standard Deviation (Sample) | 9.0% | 12.1% |
| Standard Deviation (Population) | 8.8% | 12.0% |
Similar Demographics by In Labor Force | Age 25-29
Demographics Similar to Immigrants from Latvia by In Labor Force | Age 25-29
In terms of in labor force | age 25-29, the demographic groups most similar to Immigrants from Latvia are Yugoslavian (85.6%, a difference of 0.0%), Immigrants from Poland (85.6%, a difference of 0.020%), Swedish (85.6%, a difference of 0.030%), Italian (85.6%, a difference of 0.040%), and Turkish (85.6%, a difference of 0.050%).
| Demographics | Rating | Rank | In Labor Force | Age 25-29 |
| Macedonians | 99.9 /100 | #44 | Exceptional 85.7% |
| Immigrants | Sierra Leone | 99.9 /100 | #45 | Exceptional 85.7% |
| Czechs | 99.8 /100 | #46 | Exceptional 85.6% |
| Turks | 99.8 /100 | #47 | Exceptional 85.6% |
| Italians | 99.8 /100 | #48 | Exceptional 85.6% |
| Swedes | 99.8 /100 | #49 | Exceptional 85.6% |
| Yugoslavians | 99.8 /100 | #50 | Exceptional 85.6% |
| Immigrants | Latvia | 99.8 /100 | #51 | Exceptional 85.6% |
| Immigrants | Poland | 99.7 /100 | #52 | Exceptional 85.6% |
| Belgians | 99.7 /100 | #53 | Exceptional 85.5% |
| Albanians | 99.7 /100 | #54 | Exceptional 85.5% |
| Immigrants | Brazil | 99.7 /100 | #55 | Exceptional 85.5% |
| Eastern Europeans | 99.6 /100 | #56 | Exceptional 85.5% |
| Estonians | 99.6 /100 | #57 | Exceptional 85.5% |
| Greeks | 99.6 /100 | #58 | Exceptional 85.5% |
Demographics Similar to Scotch-Irish by In Labor Force | Age 25-29
In terms of in labor force | age 25-29, the demographic groups most similar to Scotch-Irish are Arab (84.2%, a difference of 0.010%), Jordanian (84.2%, a difference of 0.010%), Immigrants from West Indies (84.2%, a difference of 0.010%), Nigerian (84.3%, a difference of 0.020%), and Korean (84.2%, a difference of 0.020%).
| Demographics | Rating | Rank | In Labor Force | Age 25-29 |
| Israelis | 9.3 /100 | #216 | Tragic 84.3% |
| Immigrants | Ecuador | 9.3 /100 | #217 | Tragic 84.3% |
| Immigrants | Nigeria | 9.0 /100 | #218 | Tragic 84.3% |
| Immigrants | Saudi Arabia | 8.8 /100 | #219 | Tragic 84.3% |
| Nigerians | 7.2 /100 | #220 | Tragic 84.3% |
| Arabs | 6.8 /100 | #221 | Tragic 84.2% |
| Jordanians | 6.7 /100 | #222 | Tragic 84.2% |
| Scotch-Irish | 6.5 /100 | #223 | Tragic 84.2% |
| Immigrants | West Indies | 6.0 /100 | #224 | Tragic 84.2% |
| Koreans | 5.9 /100 | #225 | Tragic 84.2% |
| Immigrants | Congo | 5.8 /100 | #226 | Tragic 84.2% |
| French American Indians | 5.5 /100 | #227 | Tragic 84.2% |
| Immigrants | Panama | 5.5 /100 | #228 | Tragic 84.2% |
| Immigrants | Oceania | 5.0 /100 | #229 | Tragic 84.2% |
| Whites/Caucasians | 4.8 /100 | #230 | Tragic 84.2% |