Immigrants from Jamaica vs Immigrants from Armenia In Labor Force | Age 20-24
COMPARE
Immigrants from Jamaica
Immigrants from Armenia
In Labor Force | Age 20-24
In Labor Force | Age 20-24 Comparison
Immigrants from Jamaica
Immigrants from Armenia
72.4%
IN LABOR FORCE | AGE 20-24
0.0/ 100
METRIC RATING
306th/ 347
METRIC RANK
71.7%
IN LABOR FORCE | AGE 20-24
0.0/ 100
METRIC RATING
317th/ 347
METRIC RANK
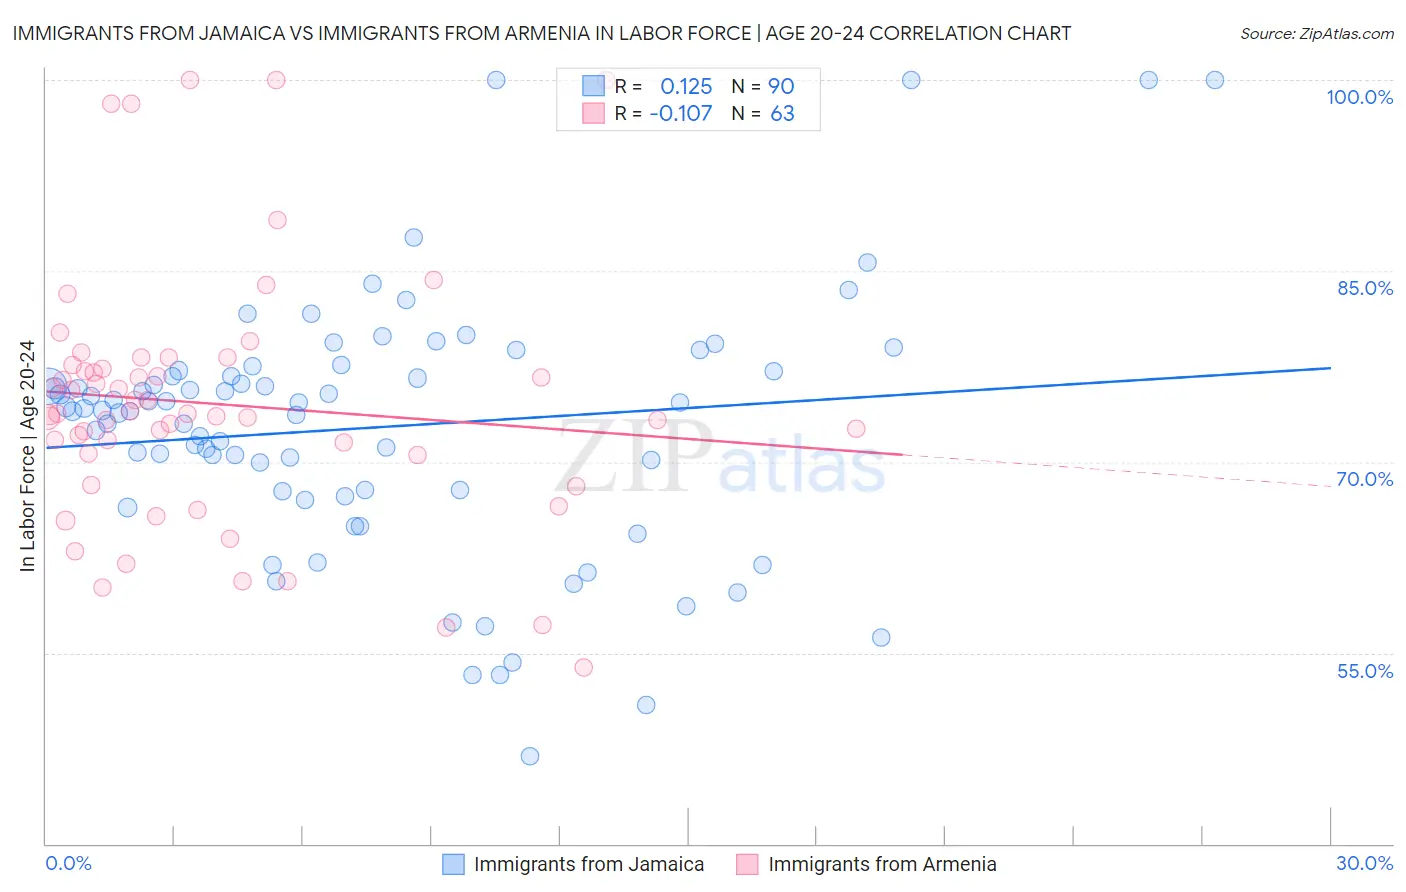
Immigrants from Jamaica vs Immigrants from Armenia In Labor Force | Age 20-24 Correlation Chart
The statistical analysis conducted on geographies consisting of 301,749,902 people shows a poor positive correlation between the proportion of Immigrants from Jamaica and labor force participation rate among population between the ages 20 and 24 in the United States with a correlation coefficient (R) of 0.125 and weighted average of 72.4%. Similarly, the statistical analysis conducted on geographies consisting of 97,714,117 people shows a poor negative correlation between the proportion of Immigrants from Armenia and labor force participation rate among population between the ages 20 and 24 in the United States with a correlation coefficient (R) of -0.107 and weighted average of 71.7%, a difference of 0.99%.
In Labor Force | Age 20-24 Correlation Summary
| Measurement | Immigrants from Jamaica | Immigrants from Armenia |
| Minimum | 46.9% | 53.8% |
| Maximum | 100.0% | 100.0% |
| Range | 53.1% | 46.2% |
| Mean | 72.7% | 74.6% |
| Median | 74.1% | 73.8% |
| Interquartile 25% (IQ1) | 67.7% | 70.5% |
| Interquartile 75% (IQ3) | 77.1% | 77.6% |
| Interquartile Range (IQR) | 9.4% | 7.1% |
| Standard Deviation (Sample) | 10.1% | 10.0% |
| Standard Deviation (Population) | 10.0% | 9.9% |
Demographics Similar to Immigrants from Jamaica and Immigrants from Armenia by In Labor Force | Age 20-24
In terms of in labor force | age 20-24, the demographic groups most similar to Immigrants from Jamaica are Immigrants from Singapore (72.4%, a difference of 0.020%), Immigrants from West Indies (72.4%, a difference of 0.050%), Ecuadorian (72.4%, a difference of 0.060%), Native/Alaskan (72.4%, a difference of 0.070%), and Immigrants from Ecuador (72.3%, a difference of 0.15%). Similarly, the demographic groups most similar to Immigrants from Armenia are Immigrants from Hong Kong (71.6%, a difference of 0.090%), Immigrants from Israel (71.6%, a difference of 0.12%), Immigrants from Eastern Asia (71.8%, a difference of 0.17%), Trinidadian and Tobagonian (71.5%, a difference of 0.20%), and Immigrants from Iran (71.8%, a difference of 0.21%).
| Demographics | Rating | Rank | In Labor Force | Age 20-24 |
| Cubans | 0.0 /100 | #301 | Tragic 72.5% |
| Natives/Alaskans | 0.0 /100 | #302 | Tragic 72.4% |
| Ecuadorians | 0.0 /100 | #303 | Tragic 72.4% |
| Immigrants | West Indies | 0.0 /100 | #304 | Tragic 72.4% |
| Immigrants | Singapore | 0.0 /100 | #305 | Tragic 72.4% |
| Immigrants | Jamaica | 0.0 /100 | #306 | Tragic 72.4% |
| Immigrants | Ecuador | 0.0 /100 | #307 | Tragic 72.3% |
| Soviet Union | 0.0 /100 | #308 | Tragic 72.3% |
| Tsimshian | 0.0 /100 | #309 | Tragic 72.3% |
| Immigrants | Cuba | 0.0 /100 | #310 | Tragic 72.0% |
| Apache | 0.0 /100 | #311 | Tragic 72.0% |
| Immigrants | Caribbean | 0.0 /100 | #312 | Tragic 71.9% |
| Immigrants | Dominica | 0.0 /100 | #313 | Tragic 71.9% |
| Indians (Asian) | 0.0 /100 | #314 | Tragic 71.9% |
| Immigrants | Iran | 0.0 /100 | #315 | Tragic 71.8% |
| Immigrants | Eastern Asia | 0.0 /100 | #316 | Tragic 71.8% |
| Immigrants | Armenia | 0.0 /100 | #317 | Tragic 71.7% |
| Immigrants | Hong Kong | 0.0 /100 | #318 | Tragic 71.6% |
| Immigrants | Israel | 0.0 /100 | #319 | Tragic 71.6% |
| Trinidadians and Tobagonians | 0.0 /100 | #320 | Tragic 71.5% |
| Immigrants | Taiwan | 0.0 /100 | #321 | Tragic 71.5% |