Spanish American vs Immigrants from Germany In Labor Force | Age 35-44
COMPARE
Spanish American
Immigrants from Germany
In Labor Force | Age 35-44
In Labor Force | Age 35-44 Comparison
Spanish Americans
Immigrants from Germany
82.8%
IN LABOR FORCE | AGE 35-44
0.0/ 100
METRIC RATING
293rd/ 347
METRIC RANK
83.9%
IN LABOR FORCE | AGE 35-44
2.8/ 100
METRIC RATING
233rd/ 347
METRIC RANK
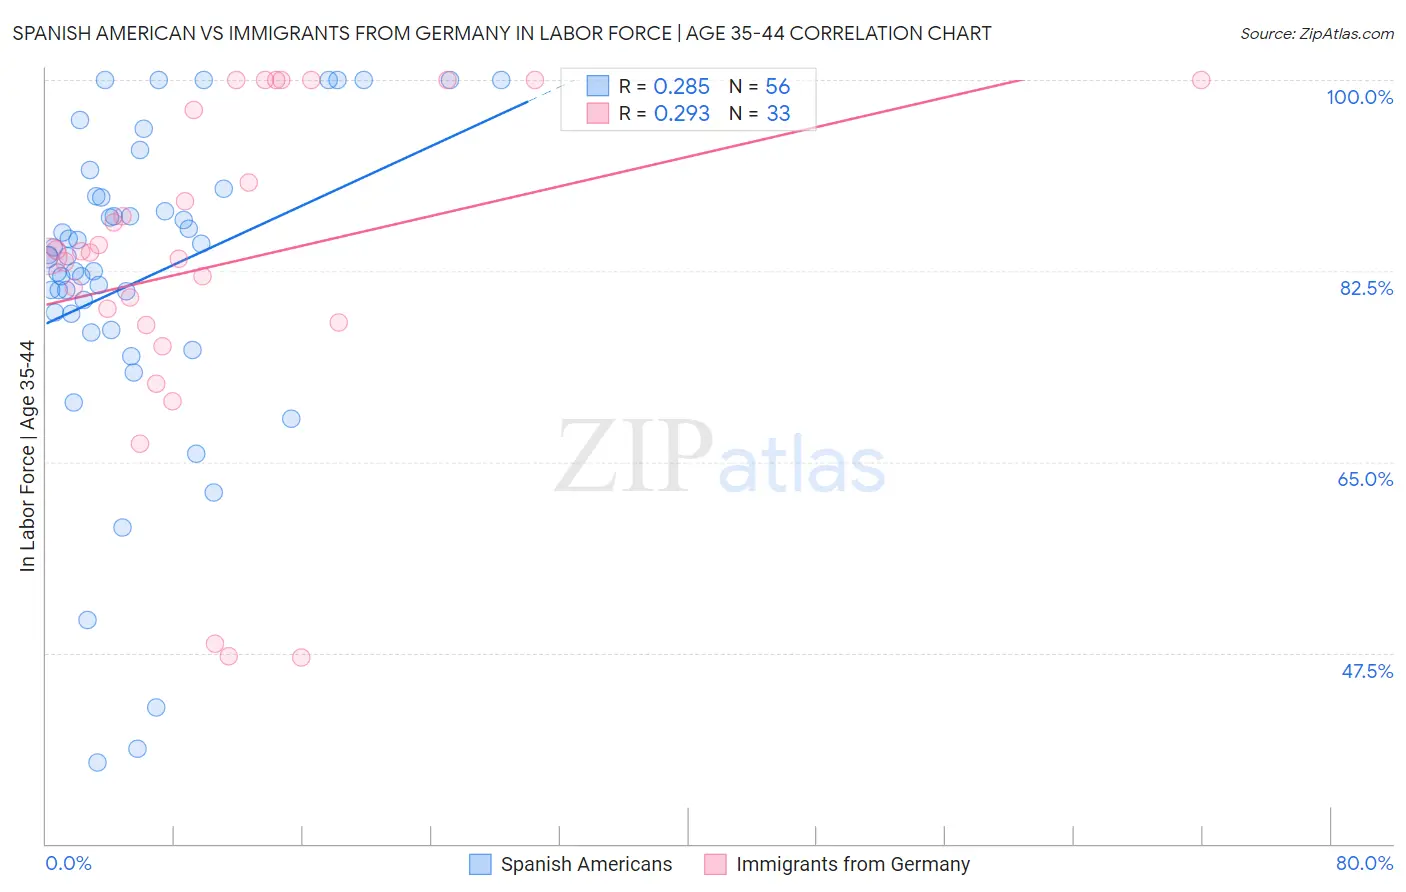
Spanish American vs Immigrants from Germany In Labor Force | Age 35-44 Correlation Chart
The statistical analysis conducted on geographies consisting of 103,164,815 people shows a weak positive correlation between the proportion of Spanish Americans and labor force participation rate among population between the ages 35 and 44 in the United States with a correlation coefficient (R) of 0.285 and weighted average of 82.8%. Similarly, the statistical analysis conducted on geographies consisting of 463,742,889 people shows a weak positive correlation between the proportion of Immigrants from Germany and labor force participation rate among population between the ages 35 and 44 in the United States with a correlation coefficient (R) of 0.293 and weighted average of 83.9%, a difference of 1.4%.
In Labor Force | Age 35-44 Correlation Summary
| Measurement | Spanish American | Immigrants from Germany |
| Minimum | 37.5% | 47.1% |
| Maximum | 100.0% | 100.0% |
| Range | 62.5% | 52.9% |
| Mean | 81.7% | 83.2% |
| Median | 83.8% | 84.2% |
| Interquartile 25% (IQ1) | 77.8% | 77.7% |
| Interquartile 75% (IQ3) | 89.2% | 98.7% |
| Interquartile Range (IQR) | 11.4% | 21.0% |
| Standard Deviation (Sample) | 14.6% | 14.9% |
| Standard Deviation (Population) | 14.5% | 14.7% |
Similar Demographics by In Labor Force | Age 35-44
Demographics Similar to Spanish Americans by In Labor Force | Age 35-44
In terms of in labor force | age 35-44, the demographic groups most similar to Spanish Americans are Potawatomi (82.7%, a difference of 0.080%), Immigrants from Latin America (82.8%, a difference of 0.090%), Immigrants from Lebanon (82.7%, a difference of 0.13%), Pennsylvania German (82.9%, a difference of 0.14%), and African (82.9%, a difference of 0.16%).
| Demographics | Rating | Rank | In Labor Force | Age 35-44 |
| Immigrants | Bangladesh | 0.0 /100 | #286 | Tragic 82.9% |
| Immigrants | Belize | 0.0 /100 | #287 | Tragic 82.9% |
| Puget Sound Salish | 0.0 /100 | #288 | Tragic 82.9% |
| Chippewa | 0.0 /100 | #289 | Tragic 82.9% |
| Africans | 0.0 /100 | #290 | Tragic 82.9% |
| Pennsylvania Germans | 0.0 /100 | #291 | Tragic 82.9% |
| Immigrants | Latin America | 0.0 /100 | #292 | Tragic 82.8% |
| Spanish Americans | 0.0 /100 | #293 | Tragic 82.8% |
| Potawatomi | 0.0 /100 | #294 | Tragic 82.7% |
| Immigrants | Lebanon | 0.0 /100 | #295 | Tragic 82.7% |
| Mexican American Indians | 0.0 /100 | #296 | Tragic 82.6% |
| Hmong | 0.0 /100 | #297 | Tragic 82.6% |
| Ottawa | 0.0 /100 | #298 | Tragic 82.6% |
| Tlingit-Haida | 0.0 /100 | #299 | Tragic 82.5% |
| Central American Indians | 0.0 /100 | #300 | Tragic 82.5% |
Demographics Similar to Immigrants from Germany by In Labor Force | Age 35-44
In terms of in labor force | age 35-44, the demographic groups most similar to Immigrants from Germany are Native Hawaiian (83.9%, a difference of 0.010%), Immigrants from Oceania (83.9%, a difference of 0.010%), Scottish (83.9%, a difference of 0.020%), Immigrants from Syria (83.9%, a difference of 0.020%), and West Indian (83.9%, a difference of 0.030%).
| Demographics | Rating | Rank | In Labor Force | Age 35-44 |
| Panamanians | 5.4 /100 | #226 | Tragic 84.0% |
| British West Indians | 5.3 /100 | #227 | Tragic 84.0% |
| Welsh | 5.3 /100 | #228 | Tragic 84.0% |
| Immigrants | Thailand | 4.7 /100 | #229 | Tragic 84.0% |
| Immigrants | Iraq | 3.7 /100 | #230 | Tragic 83.9% |
| Scottish | 3.2 /100 | #231 | Tragic 83.9% |
| Native Hawaiians | 3.0 /100 | #232 | Tragic 83.9% |
| Immigrants | Germany | 2.8 /100 | #233 | Tragic 83.9% |
| Immigrants | Oceania | 2.6 /100 | #234 | Tragic 83.9% |
| Immigrants | Syria | 2.5 /100 | #235 | Tragic 83.9% |
| West Indians | 2.4 /100 | #236 | Tragic 83.9% |
| English | 1.8 /100 | #237 | Tragic 83.8% |
| Immigrants | Laos | 1.7 /100 | #238 | Tragic 83.8% |
| Celtics | 1.4 /100 | #239 | Tragic 83.8% |
| Arabs | 1.3 /100 | #240 | Tragic 83.8% |