Czech vs Laotian In Labor Force | Age 20-24
COMPARE
Czech
Laotian
In Labor Force | Age 20-24
In Labor Force | Age 20-24 Comparison
Czechs
Laotians
78.5%
IN LABOR FORCE | AGE 20-24
100.0/ 100
METRIC RATING
14th/ 347
METRIC RANK
74.1%
IN LABOR FORCE | AGE 20-24
3.5/ 100
METRIC RATING
235th/ 347
METRIC RANK
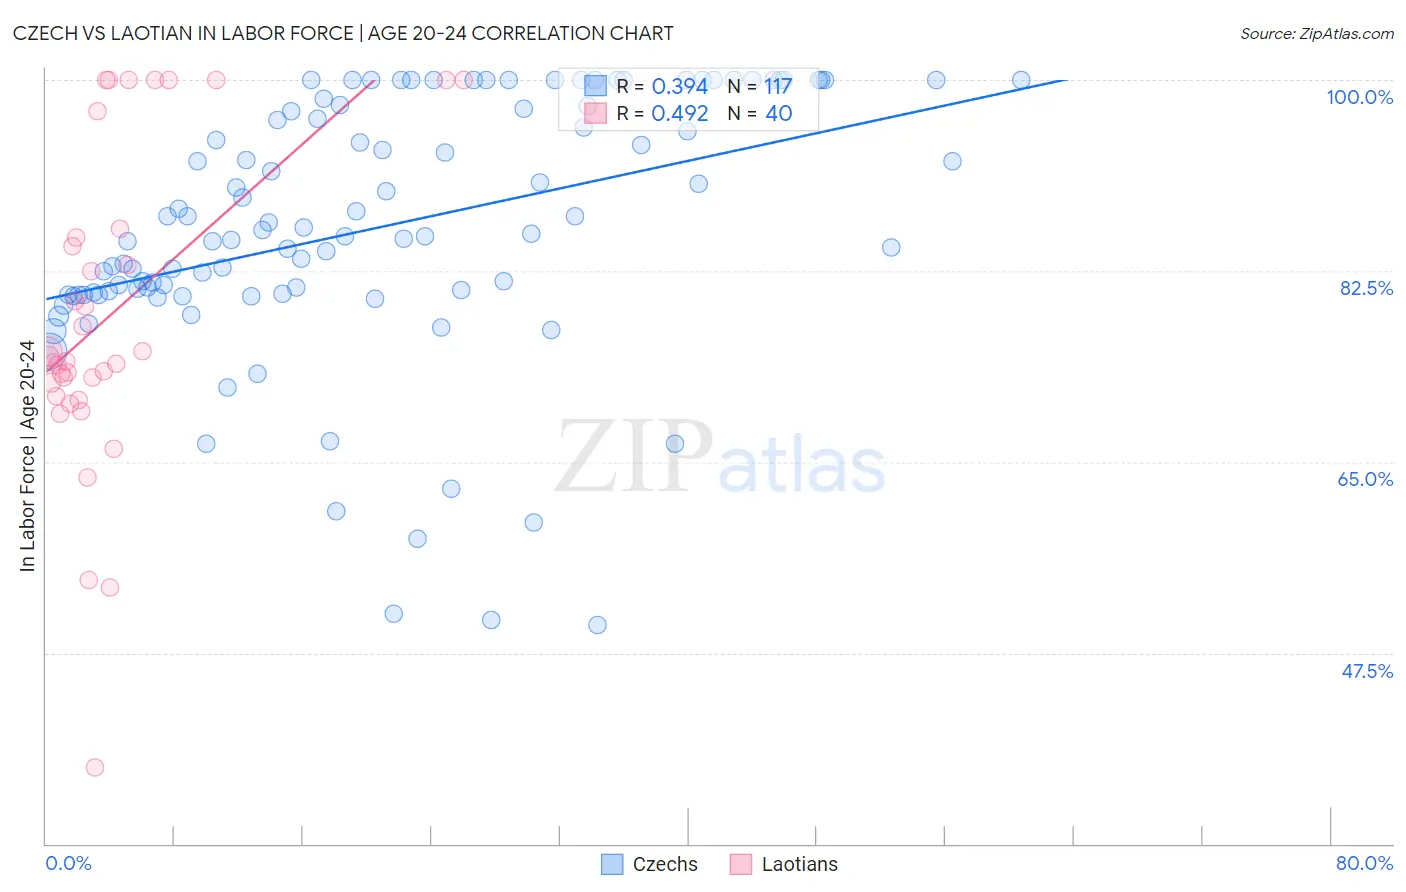
Czech vs Laotian In Labor Force | Age 20-24 Correlation Chart
The statistical analysis conducted on geographies consisting of 484,256,117 people shows a mild positive correlation between the proportion of Czechs and labor force participation rate among population between the ages 20 and 24 in the United States with a correlation coefficient (R) of 0.394 and weighted average of 78.5%. Similarly, the statistical analysis conducted on geographies consisting of 224,808,189 people shows a moderate positive correlation between the proportion of Laotians and labor force participation rate among population between the ages 20 and 24 in the United States with a correlation coefficient (R) of 0.492 and weighted average of 74.1%, a difference of 5.9%.
In Labor Force | Age 20-24 Correlation Summary
| Measurement | Czech | Laotian |
| Minimum | 50.0% | 37.0% |
| Maximum | 100.0% | 100.0% |
| Range | 50.0% | 63.0% |
| Mean | 86.5% | 78.5% |
| Median | 85.9% | 74.4% |
| Interquartile 25% (IQ1) | 80.4% | 71.6% |
| Interquartile 75% (IQ3) | 97.7% | 85.9% |
| Interquartile Range (IQR) | 17.3% | 14.3% |
| Standard Deviation (Sample) | 11.8% | 14.5% |
| Standard Deviation (Population) | 11.7% | 14.3% |
Similar Demographics by In Labor Force | Age 20-24
Demographics Similar to Czechs by In Labor Force | Age 20-24
In terms of in labor force | age 20-24, the demographic groups most similar to Czechs are Scandinavian (78.5%, a difference of 0.010%), German (78.6%, a difference of 0.070%), Sudanese (78.4%, a difference of 0.13%), Dutch (78.4%, a difference of 0.18%), and Finnish (78.7%, a difference of 0.19%).
| Demographics | Rating | Rank | In Labor Force | Age 20-24 |
| Luxembourgers | 100.0 /100 | #7 | Exceptional 79.0% |
| Immigrants | Cabo Verde | 100.0 /100 | #8 | Exceptional 78.9% |
| Swedes | 100.0 /100 | #9 | Exceptional 78.8% |
| Slovenes | 100.0 /100 | #10 | Exceptional 78.7% |
| Finns | 100.0 /100 | #11 | Exceptional 78.7% |
| Germans | 100.0 /100 | #12 | Exceptional 78.6% |
| Scandinavians | 100.0 /100 | #13 | Exceptional 78.5% |
| Czechs | 100.0 /100 | #14 | Exceptional 78.5% |
| Sudanese | 100.0 /100 | #15 | Exceptional 78.4% |
| Dutch | 100.0 /100 | #16 | Exceptional 78.4% |
| Cape Verdeans | 100.0 /100 | #17 | Exceptional 78.3% |
| Immigrants | Bosnia and Herzegovina | 100.0 /100 | #18 | Exceptional 78.1% |
| Bangladeshis | 100.0 /100 | #19 | Exceptional 78.1% |
| French Canadians | 100.0 /100 | #20 | Exceptional 78.1% |
| Puget Sound Salish | 100.0 /100 | #21 | Exceptional 78.0% |
Demographics Similar to Laotians by In Labor Force | Age 20-24
In terms of in labor force | age 20-24, the demographic groups most similar to Laotians are Immigrants (74.1%, a difference of 0.010%), Immigrants from Chile (74.1%, a difference of 0.020%), Immigrants from France (74.1%, a difference of 0.020%), Bermudan (74.1%, a difference of 0.030%), and Immigrants from Switzerland (74.2%, a difference of 0.060%).
| Demographics | Rating | Rank | In Labor Force | Age 20-24 |
| Immigrants | Ukraine | 5.1 /100 | #228 | Tragic 74.2% |
| Immigrants | Sweden | 4.6 /100 | #229 | Tragic 74.2% |
| Immigrants | Albania | 4.3 /100 | #230 | Tragic 74.2% |
| Immigrants | Greece | 4.1 /100 | #231 | Tragic 74.2% |
| Immigrants | Switzerland | 4.1 /100 | #232 | Tragic 74.2% |
| Immigrants | Chile | 3.7 /100 | #233 | Tragic 74.1% |
| Immigrants | Immigrants | 3.6 /100 | #234 | Tragic 74.1% |
| Laotians | 3.5 /100 | #235 | Tragic 74.1% |
| Immigrants | France | 3.3 /100 | #236 | Tragic 74.1% |
| Bermudans | 3.2 /100 | #237 | Tragic 74.1% |
| Immigrants | Japan | 3.0 /100 | #238 | Tragic 74.1% |
| Immigrants | Latin America | 2.7 /100 | #239 | Tragic 74.1% |
| Immigrants | Sri Lanka | 2.3 /100 | #240 | Tragic 74.0% |
| Immigrants | Senegal | 2.1 /100 | #241 | Tragic 74.0% |
| Thais | 2.1 /100 | #242 | Tragic 74.0% |