Immigrants from Italy vs Yup'ik In Labor Force | Age 16-19
COMPARE
Immigrants from Italy
Yup'ik
In Labor Force | Age 16-19
In Labor Force | Age 16-19 Comparison
Immigrants from Italy
Yup'ik
36.4%
IN LABOR FORCE | AGE 16-19
39.1/ 100
METRIC RATING
182nd/ 347
METRIC RANK
33.3%
IN LABOR FORCE | AGE 16-19
0.1/ 100
METRIC RATING
295th/ 347
METRIC RANK
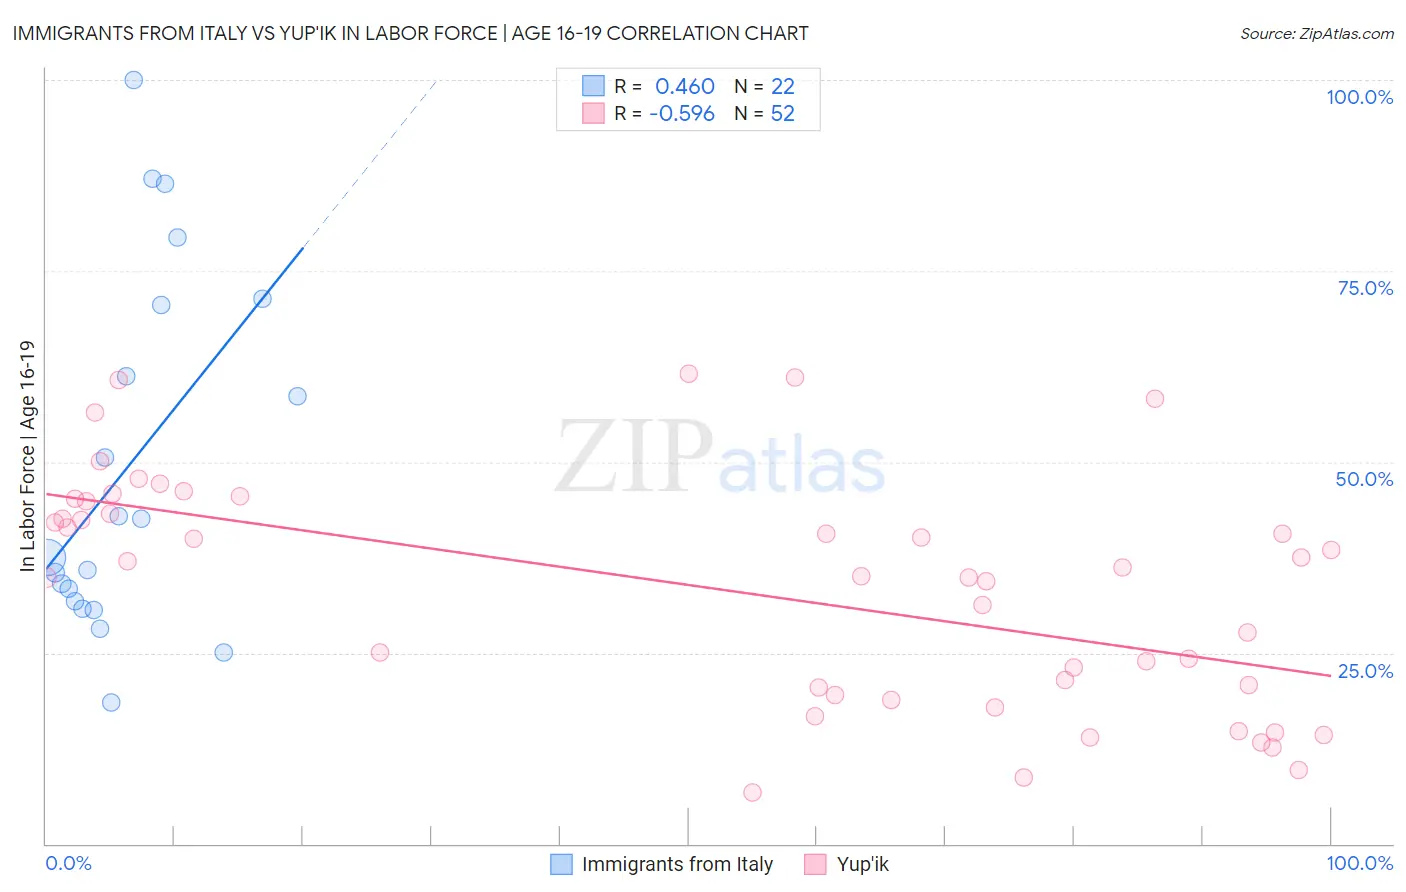
Immigrants from Italy vs Yup'ik In Labor Force | Age 16-19 Correlation Chart
The statistical analysis conducted on geographies consisting of 323,614,994 people shows a moderate positive correlation between the proportion of Immigrants from Italy and labor force participation rate among population between the ages 16 and 19 in the United States with a correlation coefficient (R) of 0.460 and weighted average of 36.4%. Similarly, the statistical analysis conducted on geographies consisting of 39,923,752 people shows a substantial negative correlation between the proportion of Yup'ik and labor force participation rate among population between the ages 16 and 19 in the United States with a correlation coefficient (R) of -0.596 and weighted average of 33.3%, a difference of 9.3%.
In Labor Force | Age 16-19 Correlation Summary
| Measurement | Immigrants from Italy | Yup'ik |
| Minimum | 18.4% | 6.7% |
| Maximum | 100.0% | 61.5% |
| Range | 81.6% | 54.8% |
| Mean | 49.6% | 33.3% |
| Median | 40.0% | 35.5% |
| Interquartile 25% (IQ1) | 31.8% | 19.9% |
| Interquartile 75% (IQ3) | 70.6% | 44.0% |
| Interquartile Range (IQR) | 38.8% | 24.1% |
| Standard Deviation (Sample) | 23.4% | 15.0% |
| Standard Deviation (Population) | 22.9% | 14.9% |
Similar Demographics by In Labor Force | Age 16-19
Demographics Similar to Immigrants from Italy by In Labor Force | Age 16-19
In terms of in labor force | age 16-19, the demographic groups most similar to Immigrants from Italy are Eastern European (36.4%, a difference of 0.020%), Jordanian (36.4%, a difference of 0.030%), Immigrants from Morocco (36.4%, a difference of 0.10%), Costa Rican (36.3%, a difference of 0.16%), and Bhutanese (36.3%, a difference of 0.21%).
| Demographics | Rating | Rank | In Labor Force | Age 16-19 |
| Natives/Alaskans | 49.0 /100 | #175 | Average 36.6% |
| Albanians | 48.8 /100 | #176 | Average 36.5% |
| Immigrants | Northern Europe | 46.6 /100 | #177 | Average 36.5% |
| Blacks/African Americans | 45.1 /100 | #178 | Average 36.5% |
| Immigrants | Southern Europe | 43.3 /100 | #179 | Average 36.4% |
| Immigrants | Morocco | 41.1 /100 | #180 | Average 36.4% |
| Jordanians | 39.6 /100 | #181 | Fair 36.4% |
| Immigrants | Italy | 39.1 /100 | #182 | Fair 36.4% |
| Eastern Europeans | 38.8 /100 | #183 | Fair 36.4% |
| Costa Ricans | 36.1 /100 | #184 | Fair 36.3% |
| Bhutanese | 35.3 /100 | #185 | Fair 36.3% |
| Immigrants | Romania | 34.0 /100 | #186 | Fair 36.3% |
| Immigrants | Afghanistan | 34.0 /100 | #187 | Fair 36.3% |
| Immigrants | Europe | 31.8 /100 | #188 | Fair 36.2% |
| Immigrants | Hungary | 28.8 /100 | #189 | Fair 36.2% |
Demographics Similar to Yup'ik by In Labor Force | Age 16-19
In terms of in labor force | age 16-19, the demographic groups most similar to Yup'ik are Argentinean (33.3%, a difference of 0.10%), Immigrants from South America (33.3%, a difference of 0.12%), Jamaican (33.2%, a difference of 0.13%), Immigrants from Haiti (33.2%, a difference of 0.22%), and Haitian (33.4%, a difference of 0.44%).
| Demographics | Rating | Rank | In Labor Force | Age 16-19 |
| Immigrants | Indonesia | 0.1 /100 | #288 | Tragic 33.5% |
| Immigrants | Singapore | 0.1 /100 | #289 | Tragic 33.5% |
| Immigrants | Colombia | 0.1 /100 | #290 | Tragic 33.5% |
| Immigrants | Belarus | 0.1 /100 | #291 | Tragic 33.4% |
| Haitians | 0.1 /100 | #292 | Tragic 33.4% |
| Immigrants | South America | 0.1 /100 | #293 | Tragic 33.3% |
| Argentineans | 0.1 /100 | #294 | Tragic 33.3% |
| Yup'ik | 0.1 /100 | #295 | Tragic 33.3% |
| Jamaicans | 0.1 /100 | #296 | Tragic 33.2% |
| Immigrants | Haiti | 0.1 /100 | #297 | Tragic 33.2% |
| Iranians | 0.0 /100 | #298 | Tragic 33.0% |
| Armenians | 0.0 /100 | #299 | Tragic 32.9% |
| Immigrants | Argentina | 0.0 /100 | #300 | Tragic 32.9% |
| Okinawans | 0.0 /100 | #301 | Tragic 32.8% |
| Belizeans | 0.0 /100 | #302 | Tragic 32.8% |