Immigrants from Italy vs Immigrants from Croatia In Labor Force | Age 45-54
COMPARE
Immigrants from Italy
Immigrants from Croatia
In Labor Force | Age 45-54
In Labor Force | Age 45-54 Comparison
Immigrants from Italy
Immigrants from Croatia
83.2%
IN LABOR FORCE | AGE 45-54
92.5/ 100
METRIC RATING
111th/ 347
METRIC RANK
83.4%
IN LABOR FORCE | AGE 45-54
96.5/ 100
METRIC RATING
80th/ 347
METRIC RANK
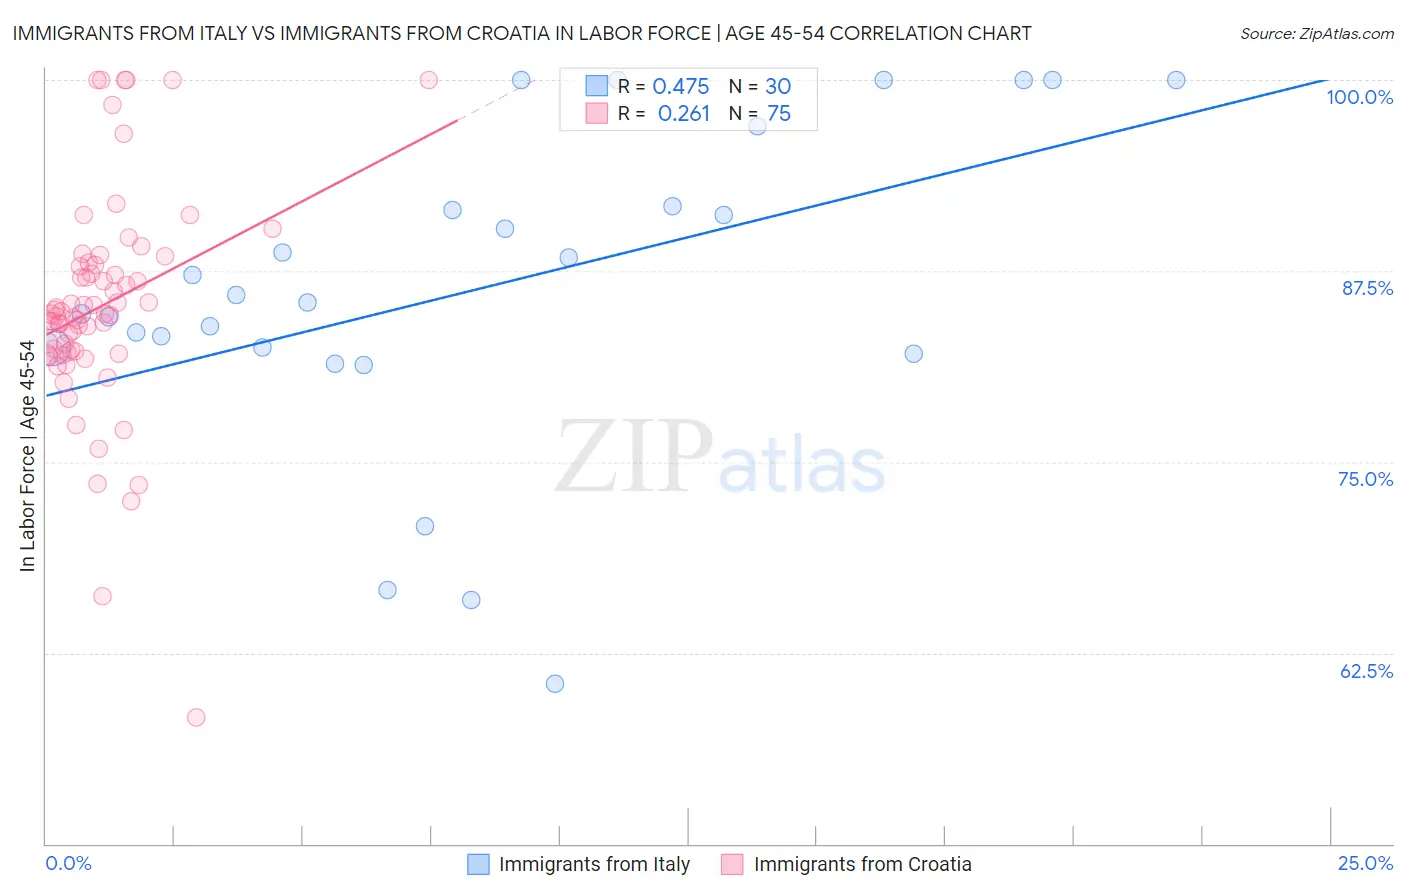
Immigrants from Italy vs Immigrants from Croatia In Labor Force | Age 45-54 Correlation Chart
The statistical analysis conducted on geographies consisting of 324,135,174 people shows a moderate positive correlation between the proportion of Immigrants from Italy and labor force participation rate among population between the ages 45 and 54 in the United States with a correlation coefficient (R) of 0.475 and weighted average of 83.2%. Similarly, the statistical analysis conducted on geographies consisting of 132,566,059 people shows a weak positive correlation between the proportion of Immigrants from Croatia and labor force participation rate among population between the ages 45 and 54 in the United States with a correlation coefficient (R) of 0.261 and weighted average of 83.4%, a difference of 0.17%.
In Labor Force | Age 45-54 Correlation Summary
| Measurement | Immigrants from Italy | Immigrants from Croatia |
| Minimum | 60.5% | 58.3% |
| Maximum | 100.0% | 100.0% |
| Range | 39.5% | 41.7% |
| Mean | 86.4% | 85.2% |
| Median | 85.7% | 84.7% |
| Interquartile 25% (IQ1) | 82.5% | 82.2% |
| Interquartile 75% (IQ3) | 91.7% | 87.9% |
| Interquartile Range (IQR) | 9.2% | 5.7% |
| Standard Deviation (Sample) | 10.5% | 7.2% |
| Standard Deviation (Population) | 10.3% | 7.2% |
Similar Demographics by In Labor Force | Age 45-54
Demographics Similar to Immigrants from Italy by In Labor Force | Age 45-54
In terms of in labor force | age 45-54, the demographic groups most similar to Immigrants from Italy are Immigrants from Africa (83.2%, a difference of 0.0%), Immigrants from Afghanistan (83.2%, a difference of 0.0%), Iranian (83.2%, a difference of 0.010%), Slovak (83.2%, a difference of 0.010%), and Ukrainian (83.2%, a difference of 0.010%).
| Demographics | Rating | Rank | In Labor Force | Age 45-54 |
| Immigrants | Romania | 93.8 /100 | #104 | Exceptional 83.3% |
| Immigrants | South America | 93.5 /100 | #105 | Exceptional 83.2% |
| Sri Lankans | 93.2 /100 | #106 | Exceptional 83.2% |
| Iranians | 92.9 /100 | #107 | Exceptional 83.2% |
| Slovaks | 92.8 /100 | #108 | Exceptional 83.2% |
| Ukrainians | 92.7 /100 | #109 | Exceptional 83.2% |
| Immigrants | Africa | 92.6 /100 | #110 | Exceptional 83.2% |
| Immigrants | Italy | 92.5 /100 | #111 | Exceptional 83.2% |
| Immigrants | Afghanistan | 92.4 /100 | #112 | Exceptional 83.2% |
| Immigrants | Albania | 91.8 /100 | #113 | Exceptional 83.2% |
| Assyrians/Chaldeans/Syriacs | 91.7 /100 | #114 | Exceptional 83.2% |
| Immigrants | Chile | 91.6 /100 | #115 | Exceptional 83.2% |
| Immigrants | Malaysia | 91.4 /100 | #116 | Exceptional 83.2% |
| Immigrants | China | 90.9 /100 | #117 | Exceptional 83.2% |
| Immigrants | Europe | 90.7 /100 | #118 | Exceptional 83.2% |
Demographics Similar to Immigrants from Croatia by In Labor Force | Age 45-54
In terms of in labor force | age 45-54, the demographic groups most similar to Immigrants from Croatia are Belgian (83.4%, a difference of 0.0%), Jordanian (83.4%, a difference of 0.0%), Immigrants from Egypt (83.4%, a difference of 0.010%), Immigrants from Eastern Asia (83.4%, a difference of 0.010%), and Immigrants from Zimbabwe (83.4%, a difference of 0.010%).
| Demographics | Rating | Rank | In Labor Force | Age 45-54 |
| Immigrants | Czechoslovakia | 97.1 /100 | #73 | Exceptional 83.4% |
| Immigrants | Somalia | 96.9 /100 | #74 | Exceptional 83.4% |
| Estonians | 96.9 /100 | #75 | Exceptional 83.4% |
| Russians | 96.8 /100 | #76 | Exceptional 83.4% |
| Cubans | 96.7 /100 | #77 | Exceptional 83.4% |
| Immigrants | Egypt | 96.6 /100 | #78 | Exceptional 83.4% |
| Belgians | 96.5 /100 | #79 | Exceptional 83.4% |
| Immigrants | Croatia | 96.5 /100 | #80 | Exceptional 83.4% |
| Jordanians | 96.4 /100 | #81 | Exceptional 83.4% |
| Immigrants | Eastern Asia | 96.3 /100 | #82 | Exceptional 83.4% |
| Immigrants | Zimbabwe | 96.3 /100 | #83 | Exceptional 83.4% |
| Immigrants | Bosnia and Herzegovina | 96.0 /100 | #84 | Exceptional 83.3% |
| Greeks | 95.9 /100 | #85 | Exceptional 83.3% |
| Immigrants | Northern Africa | 95.7 /100 | #86 | Exceptional 83.3% |
| Immigrants | Eastern Europe | 95.6 /100 | #87 | Exceptional 83.3% |