Immigrants from Ireland vs Sioux In Labor Force | Age 20-24
COMPARE
Immigrants from Ireland
Sioux
In Labor Force | Age 20-24
In Labor Force | Age 20-24 Comparison
Immigrants from Ireland
Sioux
74.3%
IN LABOR FORCE | AGE 20-24
5.8/ 100
METRIC RATING
227th/ 347
METRIC RANK
74.6%
IN LABOR FORCE | AGE 20-24
17.5/ 100
METRIC RATING
206th/ 347
METRIC RANK
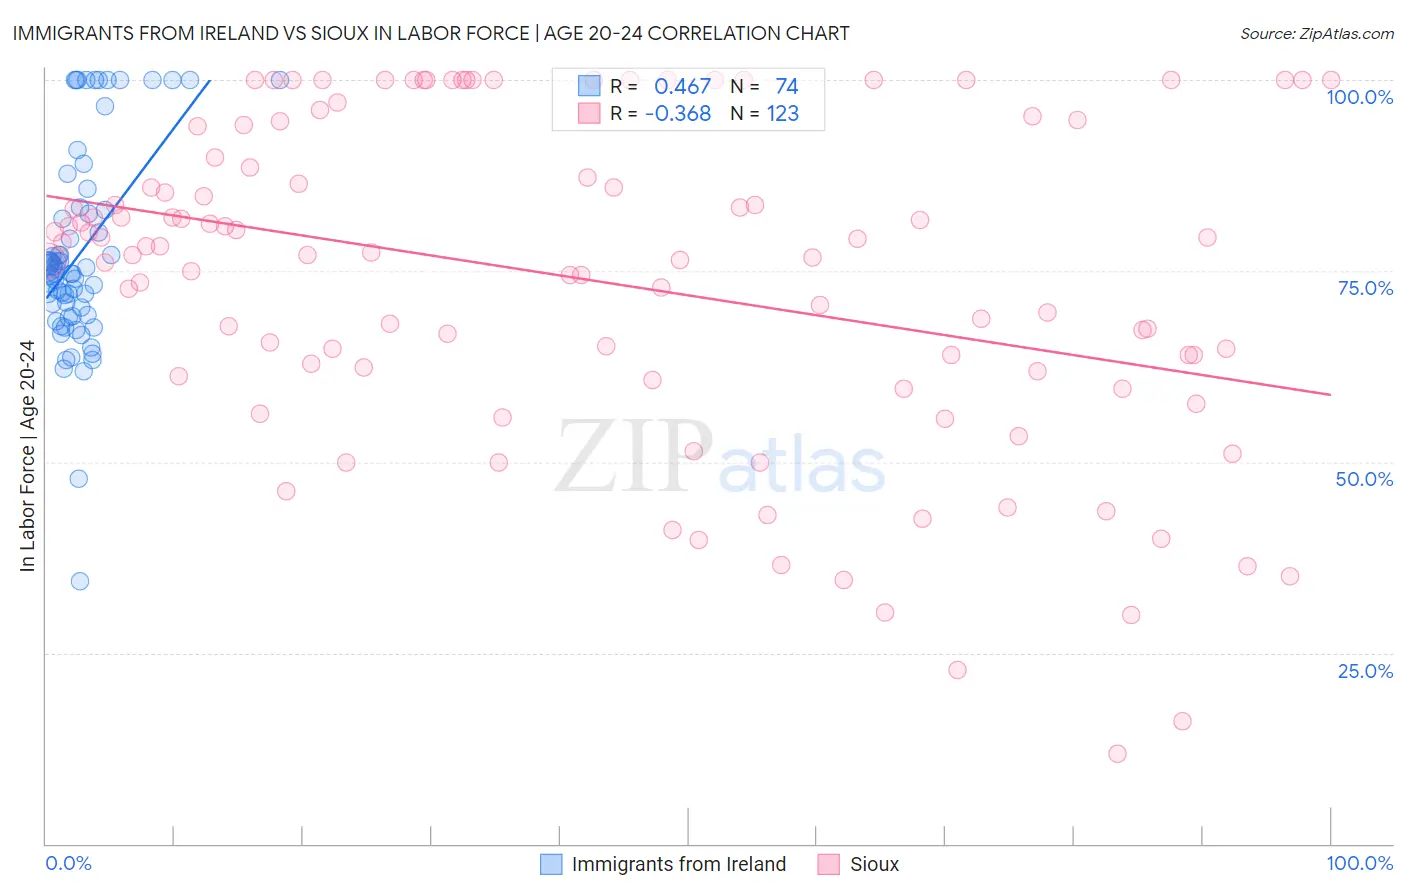
Immigrants from Ireland vs Sioux In Labor Force | Age 20-24 Correlation Chart
The statistical analysis conducted on geographies consisting of 240,706,674 people shows a moderate positive correlation between the proportion of Immigrants from Ireland and labor force participation rate among population between the ages 20 and 24 in the United States with a correlation coefficient (R) of 0.467 and weighted average of 74.3%. Similarly, the statistical analysis conducted on geographies consisting of 234,099,226 people shows a mild negative correlation between the proportion of Sioux and labor force participation rate among population between the ages 20 and 24 in the United States with a correlation coefficient (R) of -0.368 and weighted average of 74.6%, a difference of 0.46%.
In Labor Force | Age 20-24 Correlation Summary
| Measurement | Immigrants from Ireland | Sioux |
| Minimum | 34.3% | 11.8% |
| Maximum | 100.0% | 100.0% |
| Range | 65.7% | 88.2% |
| Mean | 77.3% | 73.8% |
| Median | 74.9% | 77.4% |
| Interquartile 25% (IQ1) | 69.2% | 61.2% |
| Interquartile 75% (IQ3) | 82.9% | 93.9% |
| Interquartile Range (IQR) | 13.7% | 32.7% |
| Standard Deviation (Sample) | 13.1% | 21.4% |
| Standard Deviation (Population) | 13.0% | 21.3% |
Similar Demographics by In Labor Force | Age 20-24
Demographics Similar to Immigrants from Ireland by In Labor Force | Age 20-24
In terms of in labor force | age 20-24, the demographic groups most similar to Immigrants from Ireland are Immigrants from Fiji (74.3%, a difference of 0.010%), Ghanaian (74.3%, a difference of 0.030%), Immigrants from Ukraine (74.2%, a difference of 0.050%), Seminole (74.3%, a difference of 0.070%), and Immigrants from Sweden (74.2%, a difference of 0.090%).
| Demographics | Rating | Rank | In Labor Force | Age 20-24 |
| Immigrants | Norway | 10.3 /100 | #220 | Poor 74.5% |
| Chickasaw | 10.3 /100 | #221 | Poor 74.5% |
| Immigrants | India | 9.9 /100 | #222 | Tragic 74.4% |
| Hispanics or Latinos | 7.9 /100 | #223 | Tragic 74.4% |
| Seminole | 6.9 /100 | #224 | Tragic 74.3% |
| Ghanaians | 6.2 /100 | #225 | Tragic 74.3% |
| Immigrants | Fiji | 5.9 /100 | #226 | Tragic 74.3% |
| Immigrants | Ireland | 5.8 /100 | #227 | Tragic 74.3% |
| Immigrants | Ukraine | 5.1 /100 | #228 | Tragic 74.2% |
| Immigrants | Sweden | 4.6 /100 | #229 | Tragic 74.2% |
| Immigrants | Albania | 4.3 /100 | #230 | Tragic 74.2% |
| Immigrants | Greece | 4.1 /100 | #231 | Tragic 74.2% |
| Immigrants | Switzerland | 4.1 /100 | #232 | Tragic 74.2% |
| Immigrants | Chile | 3.7 /100 | #233 | Tragic 74.1% |
| Immigrants | Immigrants | 3.6 /100 | #234 | Tragic 74.1% |
Demographics Similar to Sioux by In Labor Force | Age 20-24
In terms of in labor force | age 20-24, the demographic groups most similar to Sioux are Immigrants from Italy (74.6%, a difference of 0.0%), Inupiat (74.6%, a difference of 0.0%), Immigrants from Northern Africa (74.6%, a difference of 0.010%), Albanian (74.6%, a difference of 0.030%), and Immigrants from Uruguay (74.6%, a difference of 0.040%).
| Demographics | Rating | Rank | In Labor Force | Age 20-24 |
| Taiwanese | 23.2 /100 | #199 | Fair 74.7% |
| Nigerians | 21.9 /100 | #200 | Fair 74.7% |
| Choctaw | 21.4 /100 | #201 | Fair 74.7% |
| Moroccans | 20.4 /100 | #202 | Fair 74.7% |
| Immigrants | Northern Africa | 17.9 /100 | #203 | Poor 74.6% |
| Immigrants | Italy | 17.6 /100 | #204 | Poor 74.6% |
| Inupiat | 17.6 /100 | #205 | Poor 74.6% |
| Sioux | 17.5 /100 | #206 | Poor 74.6% |
| Albanians | 16.2 /100 | #207 | Poor 74.6% |
| Immigrants | Uruguay | 15.8 /100 | #208 | Poor 74.6% |
| Arabs | 15.8 /100 | #209 | Poor 74.6% |
| Uruguayans | 15.1 /100 | #210 | Poor 74.6% |
| Immigrants | Australia | 14.7 /100 | #211 | Poor 74.6% |
| Creek | 13.3 /100 | #212 | Poor 74.5% |
| Peruvians | 13.3 /100 | #213 | Poor 74.5% |